
This is the third post in my Terraform and Splunk series. After deploying Splunk with Terraform in Part 1 and setting up the Terraform Cloud integration in Splunk in Part 2, we are going to end this series for now by using Terraform to configure Splunk to monitor Terraform Cloud.
For this, we are going to be the recently-launched Terraform Provider for Splunk.
Setting up the provider
It’s pretty straight-forward to get started with the Splunk provider. I think there are some options to use authentication tokens but I just used admin/password:
terraform {
  required_providers {
    splunk = {
      source = "splunk/splunk"
      //version = "1.0.0"
    }
  }
}

provider "splunk" {
  url      = "A.B.C.D:8089"
  username = "admin"
  password = "SPLUNK-i-0aa000000000aaa000"
}
Note that API calls are made over port 8089 by default.
We can then start creating dashboards and searches.
I can refer to the Search I published in Part 2:
resource "splunk_saved_searches" "saved" {
  name                      = "Sentinel_Hard_Failed_Search"
  search                    = <<EOT
  source="terraform_cloud" sourcetype="terraform_cloud" resource.action="hard_failed"
| spath resource.meta.run.id output=Run
| spath auth.description output=User
| spath resource.meta.sentinel.data.sentinel-policy-networking.policies{} output=policies
| mvexpand policies
| spath input=policies trace.rules.main.position.filename output=filename
| spath input=policies result output=value
| where value="false" AND match(filename,"^\..hard")
| spath input=policies trace.print output=error_message
| rename filename AS Policy, error_message AS Log, timestamp AS Time
| table User Run Time Policy Log
EOT

}
The configuration below will pre-load the Search: this is handy – it means the Splunk administrator can create easy saved searches or dashboards for the consumers of Splunk:
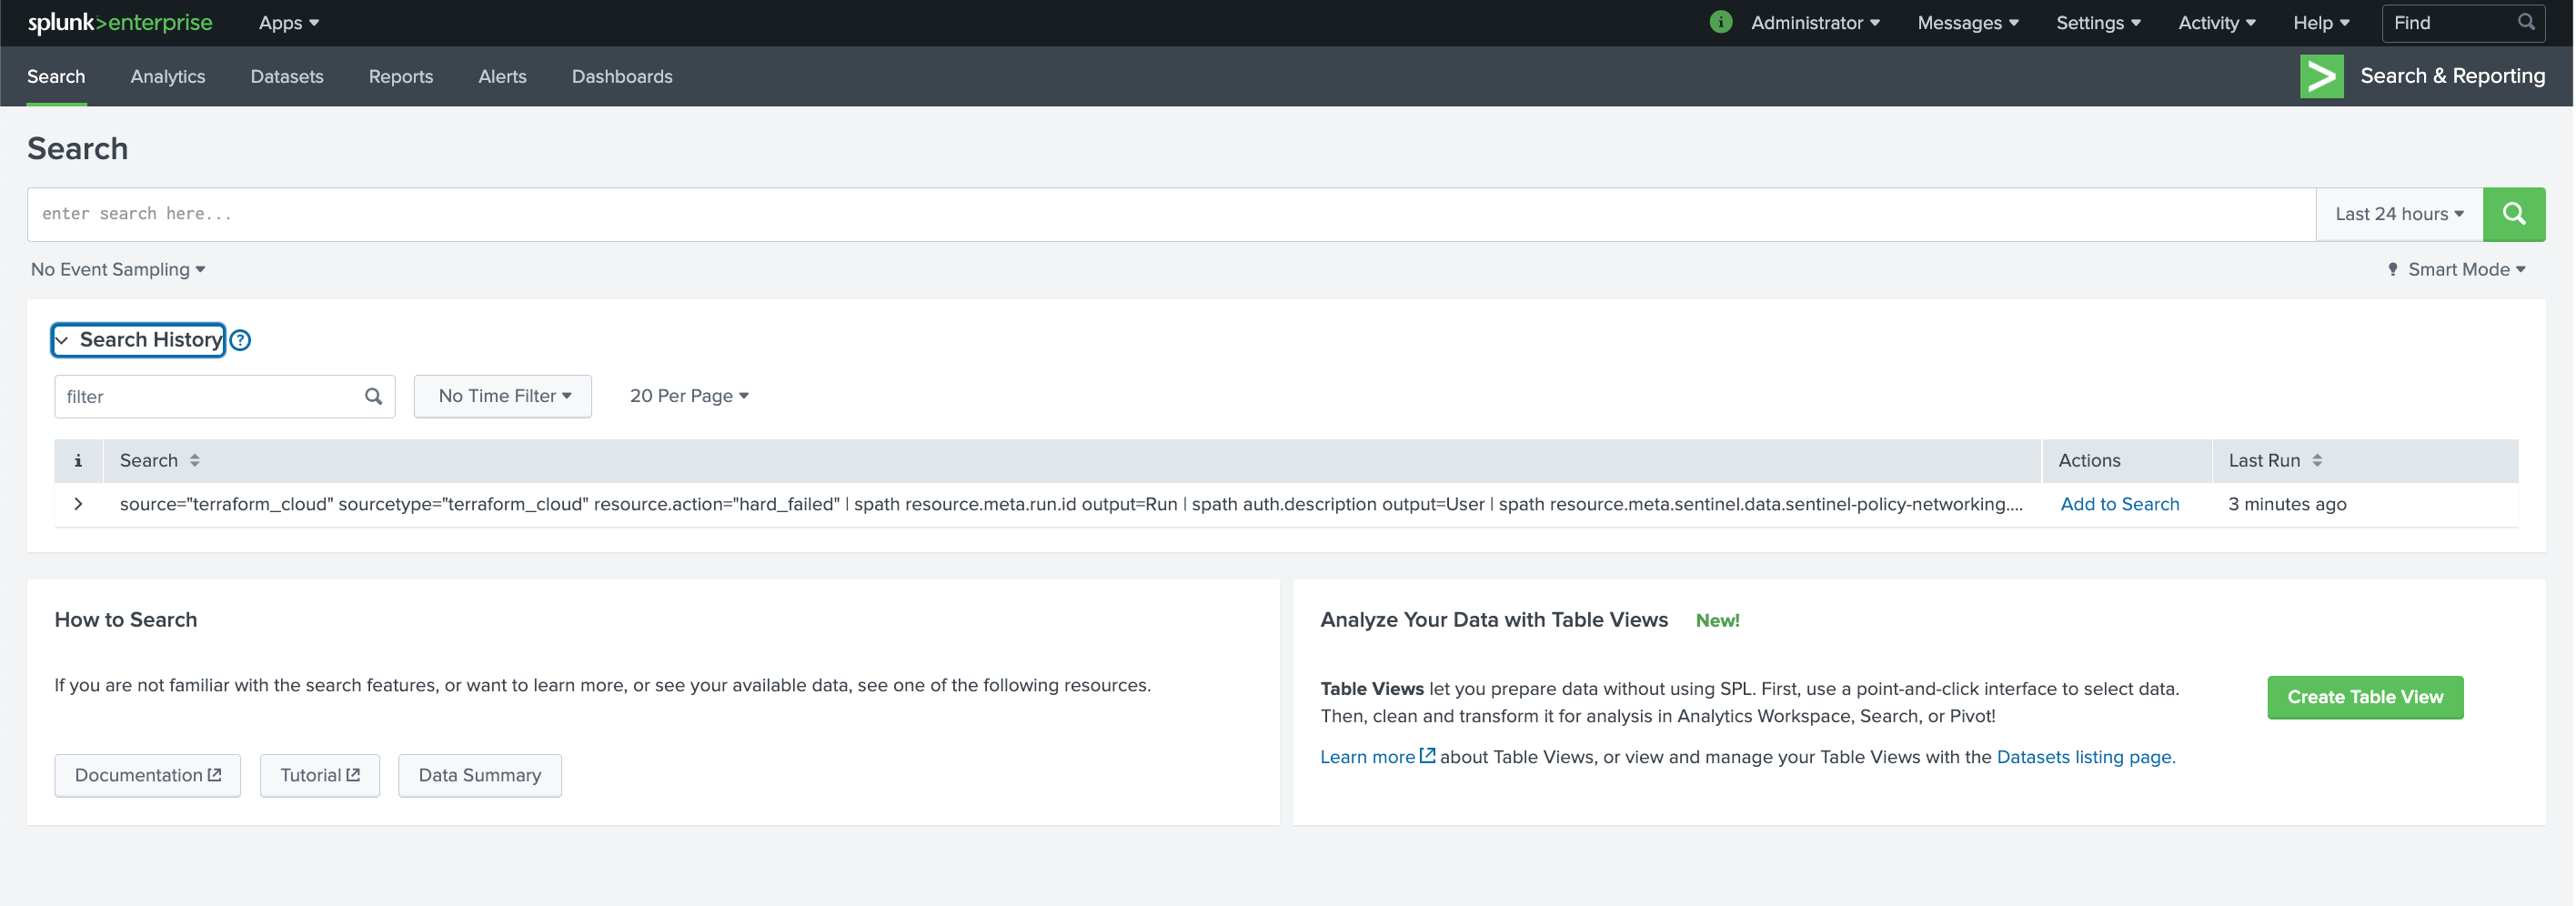
You can then press “Add to Search” and run it and get the results we saw in the previous post.

Alternatively, you can also create dashboards. The example in the docs is simple enough:
resource "splunk_data_ui_views" "dashboard" {
  name     = "Terraform_Test_Dashboard"
  eai_data = <<EOF
  <dashboard>
    <label>
      Terraform Test Dashboard
    </label>
  </dashboard>
  EOF
  acl {
    owner = "admin"
    app = "search"
  }
}
If you look at my repo, I found the XML code that describes the dashboard in the official TF Cloud for Splunk app and copy/pasted it into my Terraform code.

I recommend you also check out the Splunk Dashboard Examples app – again, you can copy the XML code and use it as you see fit: you mainly need to replace the search query with the one you want to visualize.
That’s all for now – thanks for checking out the Terraform & Splunk series.

2 thoughts on “Terraform and Splunk Part 3: Using the Terraform Provider for Splunk”