
This is Part 2 in a Terraform & Splunk Series. In Part 1, we deployed Splunk Enterprise using Terraform. The first part of my tests were actually based on Splunk Cloud as you can see from some of the screenshots below. Once I needed to use the Splunk APIs to configure Splunk with Terraform, I switched to the Splunk instance I deployed myself on AWS.
Objectives
What we will be doing in this blog is setting up Splunk to monitor my Terraform Auditing logs. As mentioned in the previous blog, I started looking into it when one of my customers wanted to delve into Sentinel logs.
We’re going to need to install the Splunk app for Terraform Cloud. We need an Organization Token for it. Just be aware you can only have one active API token at a time so be careful with it. You might want to store it in Vault.
To install the Splunk app, you ‘re going to need a Splunk account. If you create a new account like I did, make sure you log in first and validate your account first or the App Download will not work.
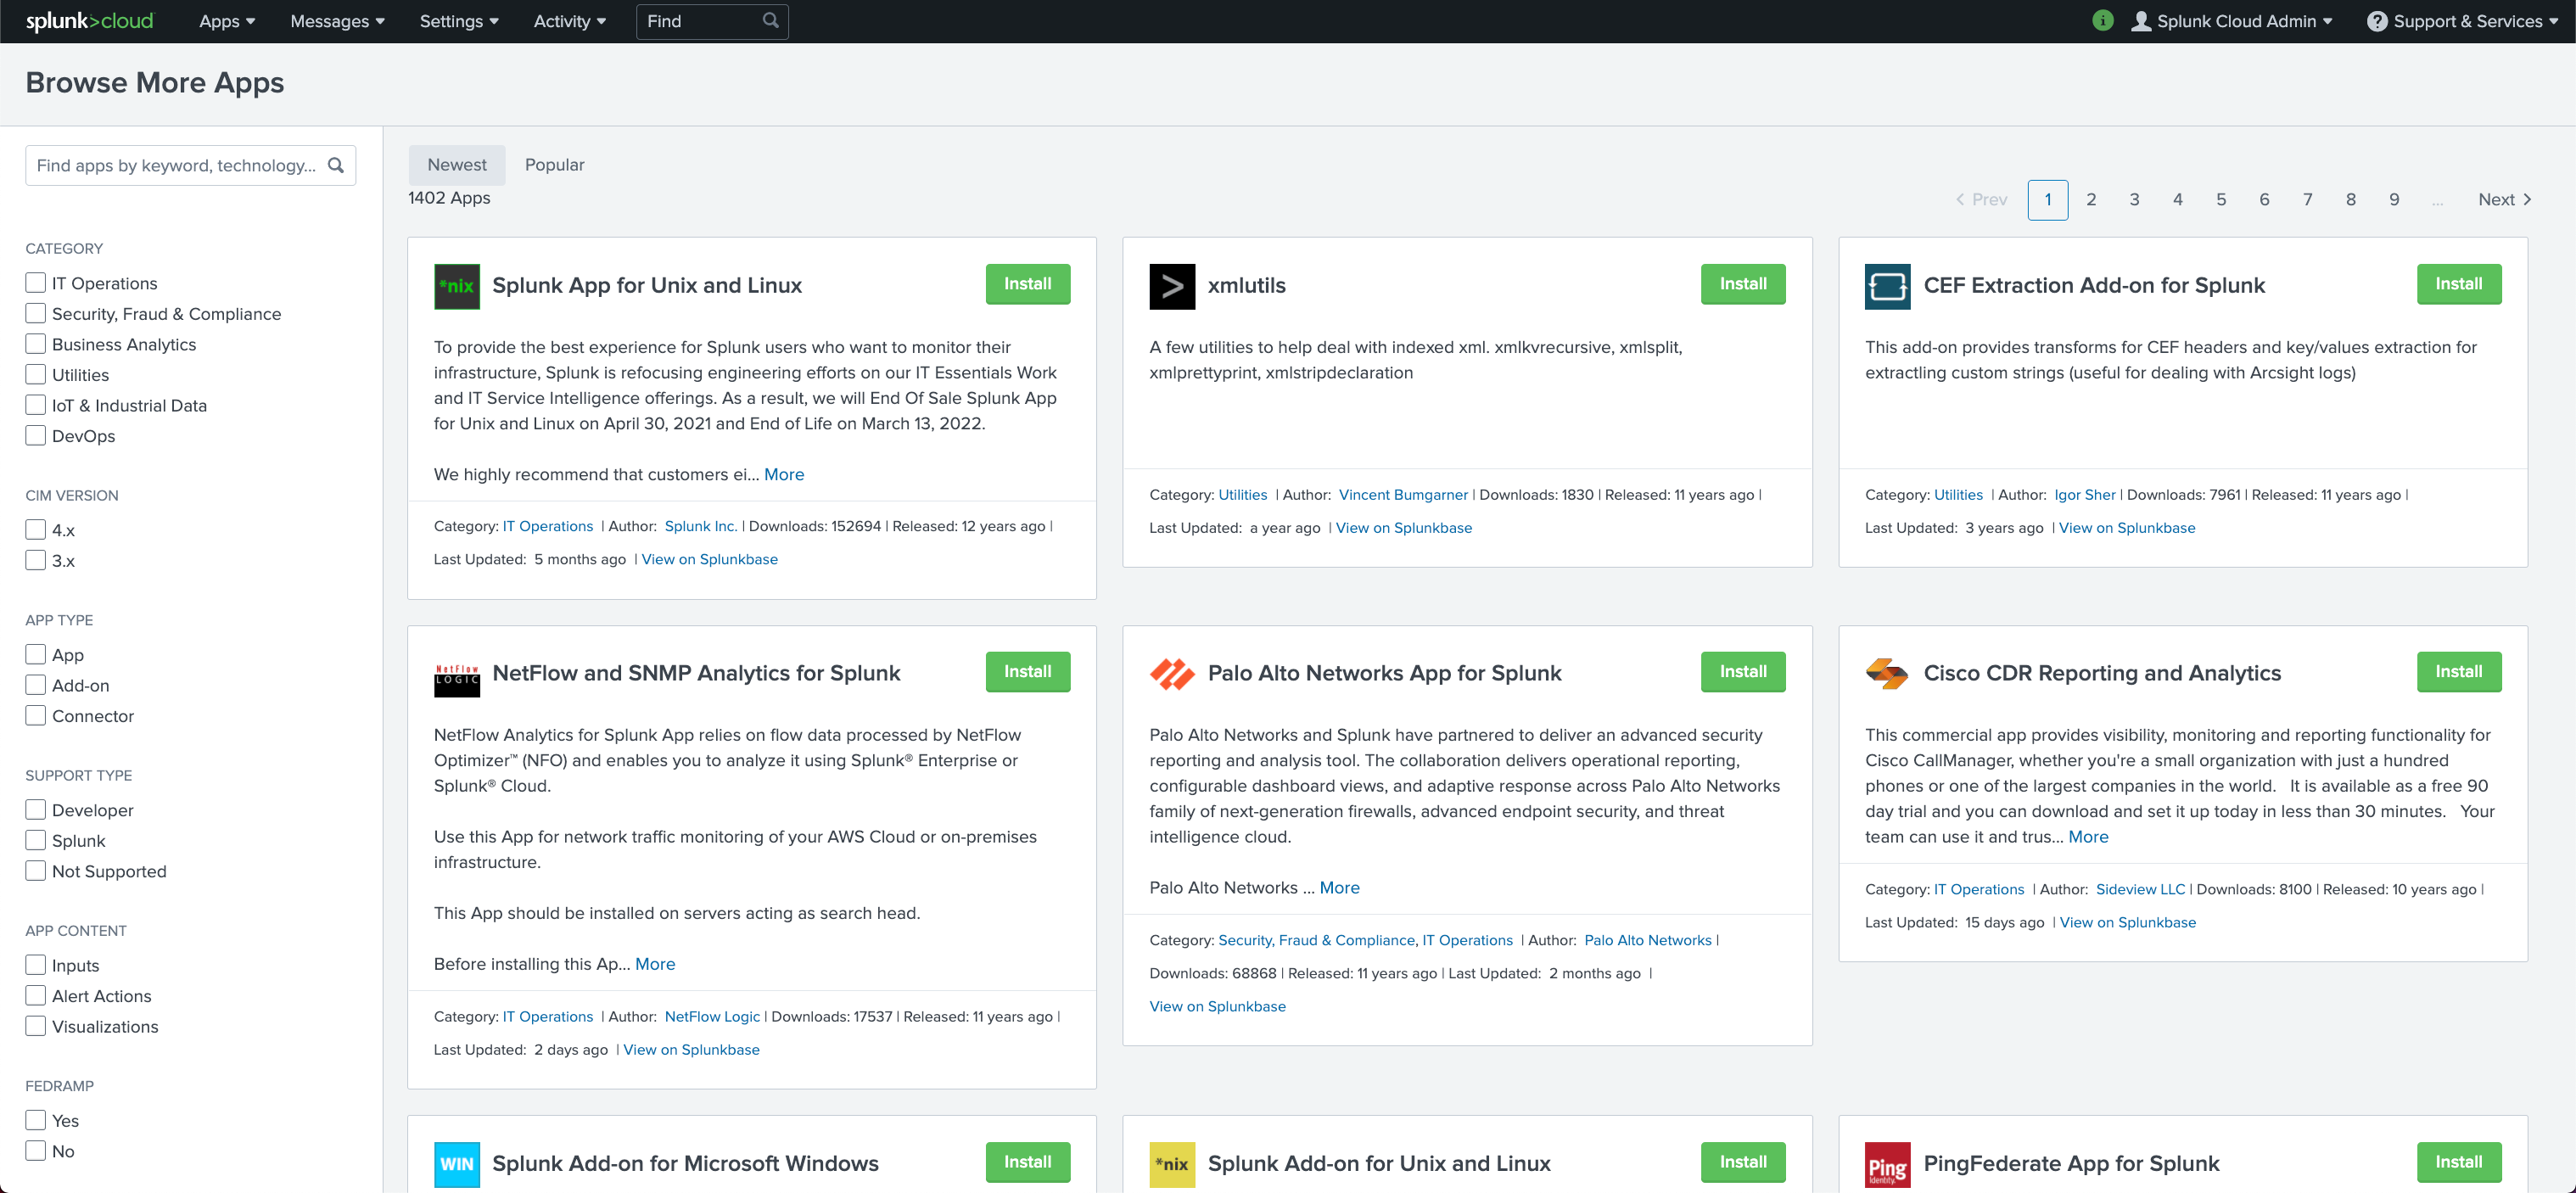
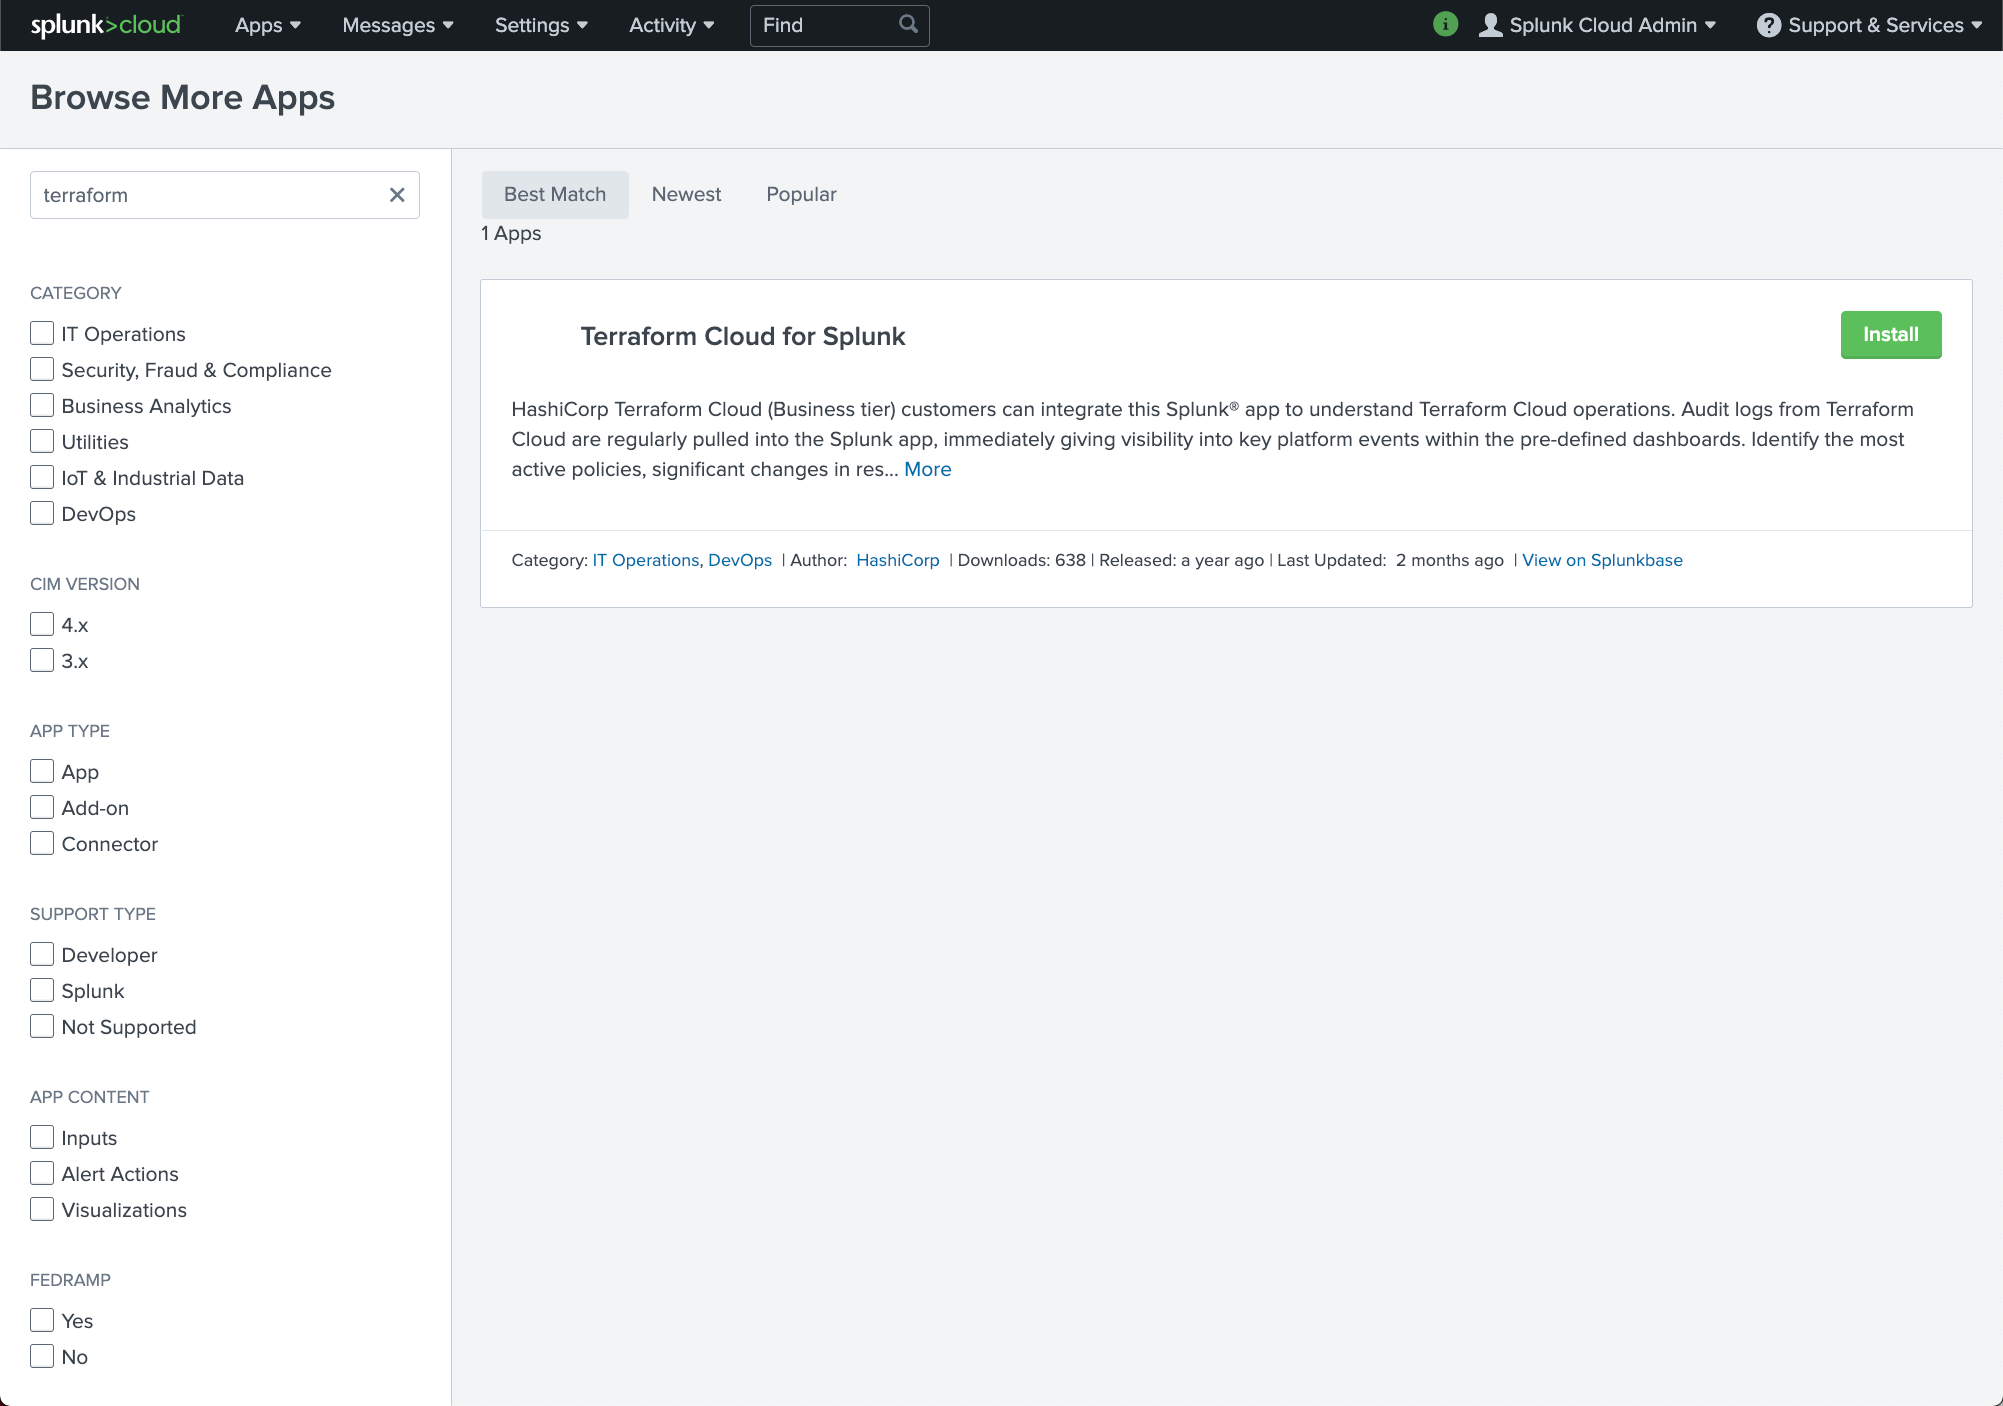
Install the Terraform Cloud for Splunk app.
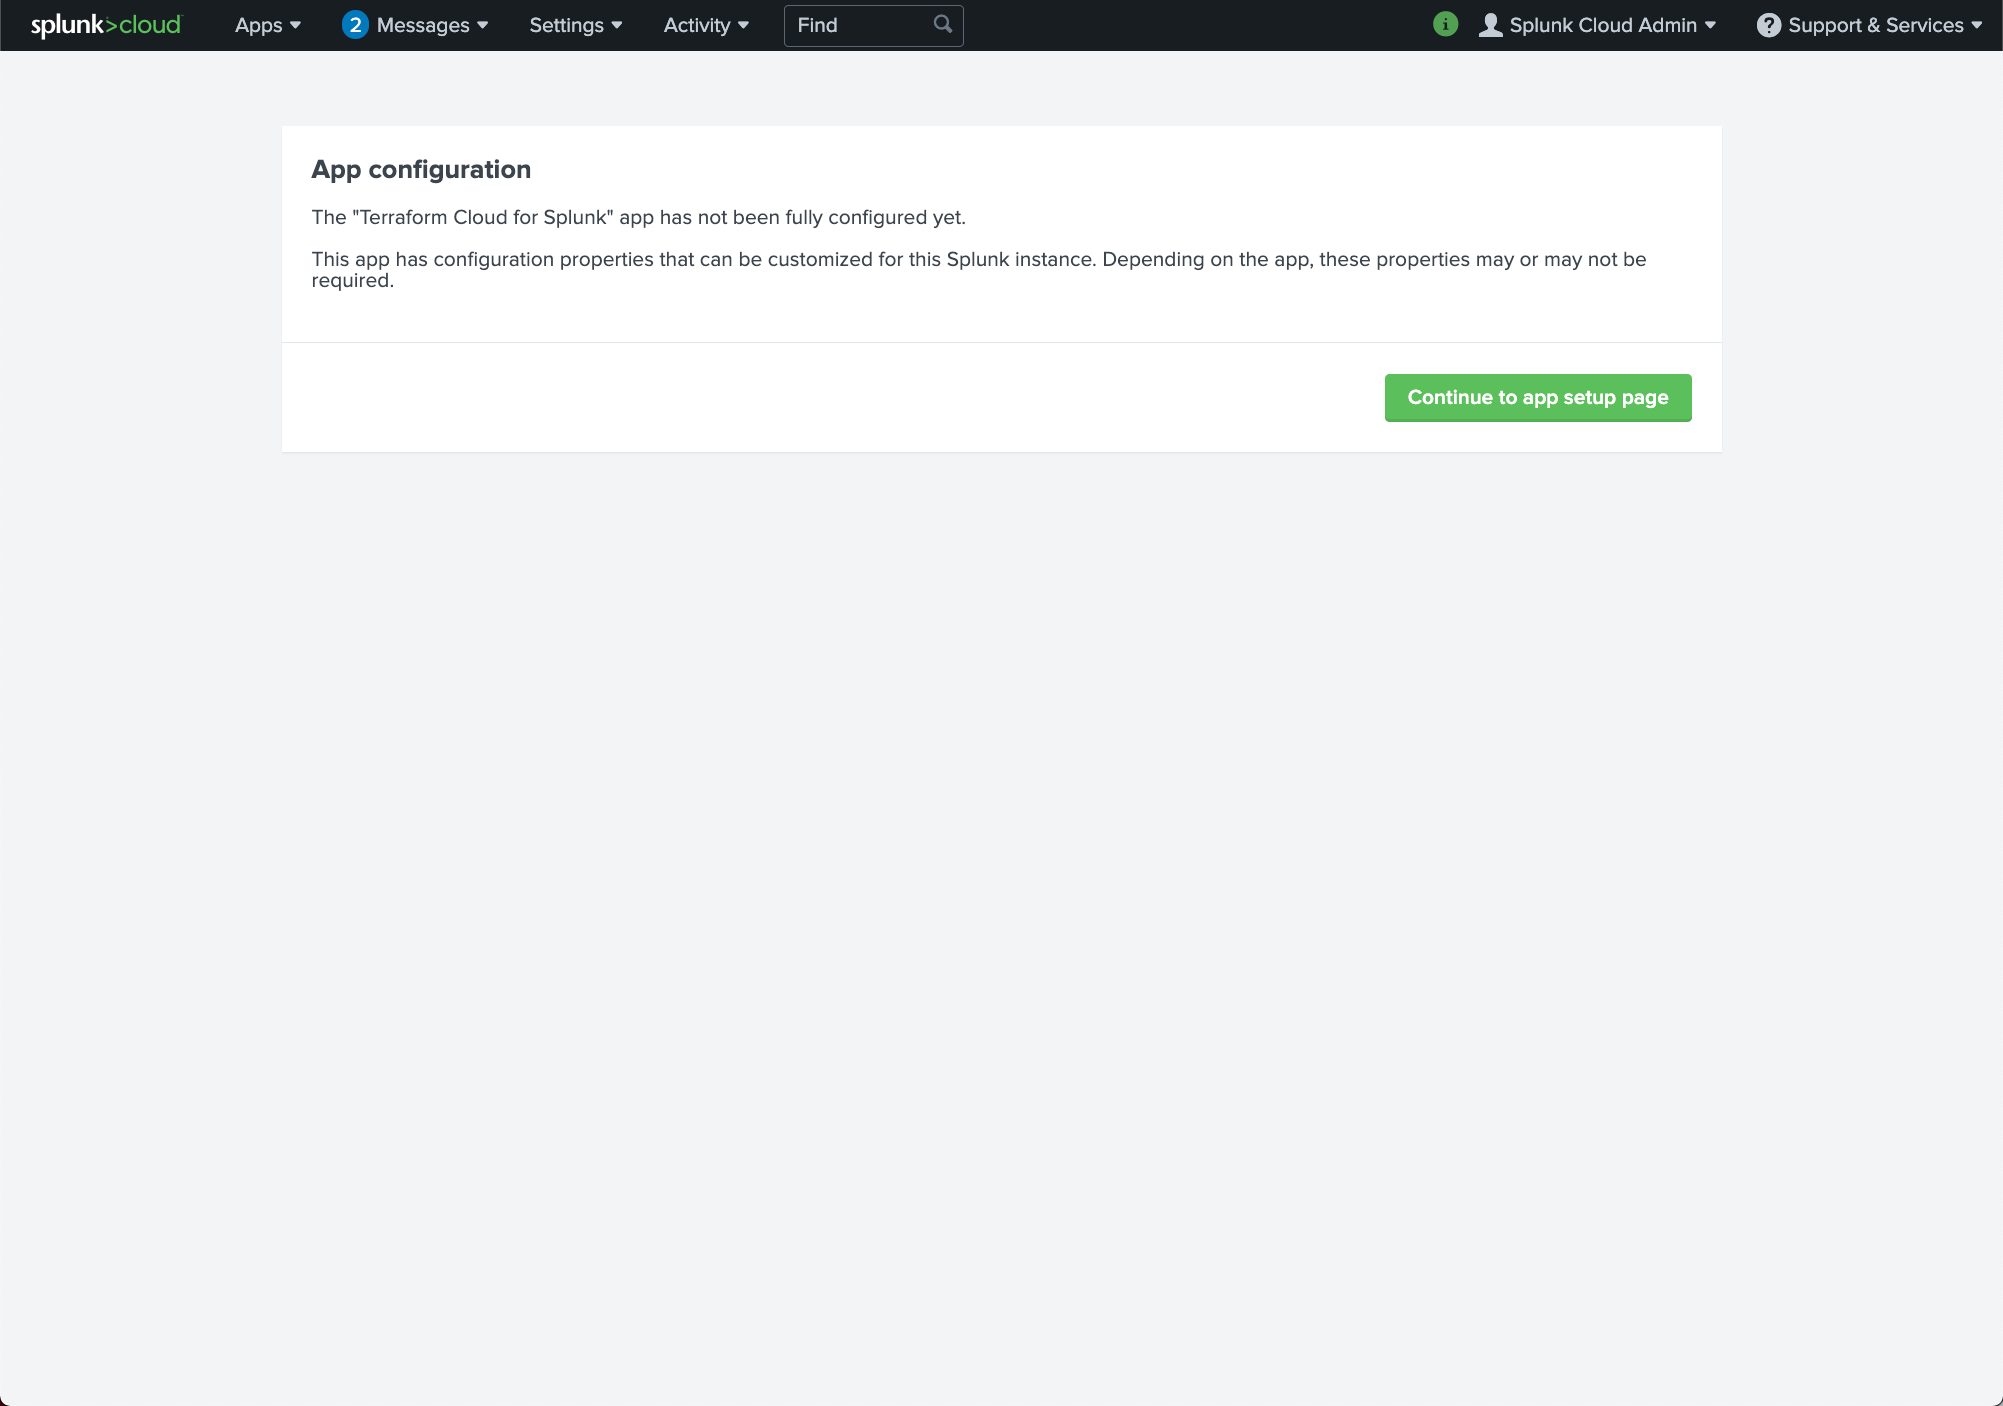
Set it up (this is when you will need the Org token):
And within minutes, the logs will appear in the app’s dashboards.

All this is described in the blog post here but I wanted to get a bit more out of the Sentinel audit logs. So I had to do a fair bit of reading up on the Splunk Search Processing Language (SPL).
I was a fair bit outside of my comfort zone here. I am by now pretty experienced and comfortable with Python, I know enough Go to write a small client for HCP Packer or to add new Terraform resources to a provider. SPL might be pretty easy for someone knows SQL but it didn’t come naturally to me. But in the end, I got some results I was happy with.
What do I want to know as a Sentinel policy auditor:
- The runs where an override was completed, with the reason/comment. I want to know who overrode the run, and why.
- The runs where it was hard-failed and the error message and the policies that failed the policy check.
Why do we want this? Well, if a user failed a policy, it means that they wrote a Terraform configuration that didn’t meet the policies requirements. So they need educating.
I also want to track who decided to override the Soft Policy fail – it’s probably fine if they did but we need to understanding why it was acceptable to override it.
The logs might also tell us that our policies were too stringent – if we get lots of failed policy checks, it might be worth looking at whether the policies were too severe in the first place.
Insight from logs
The best way to create relevant searches and dashboards is to understand the structure of the audit log.
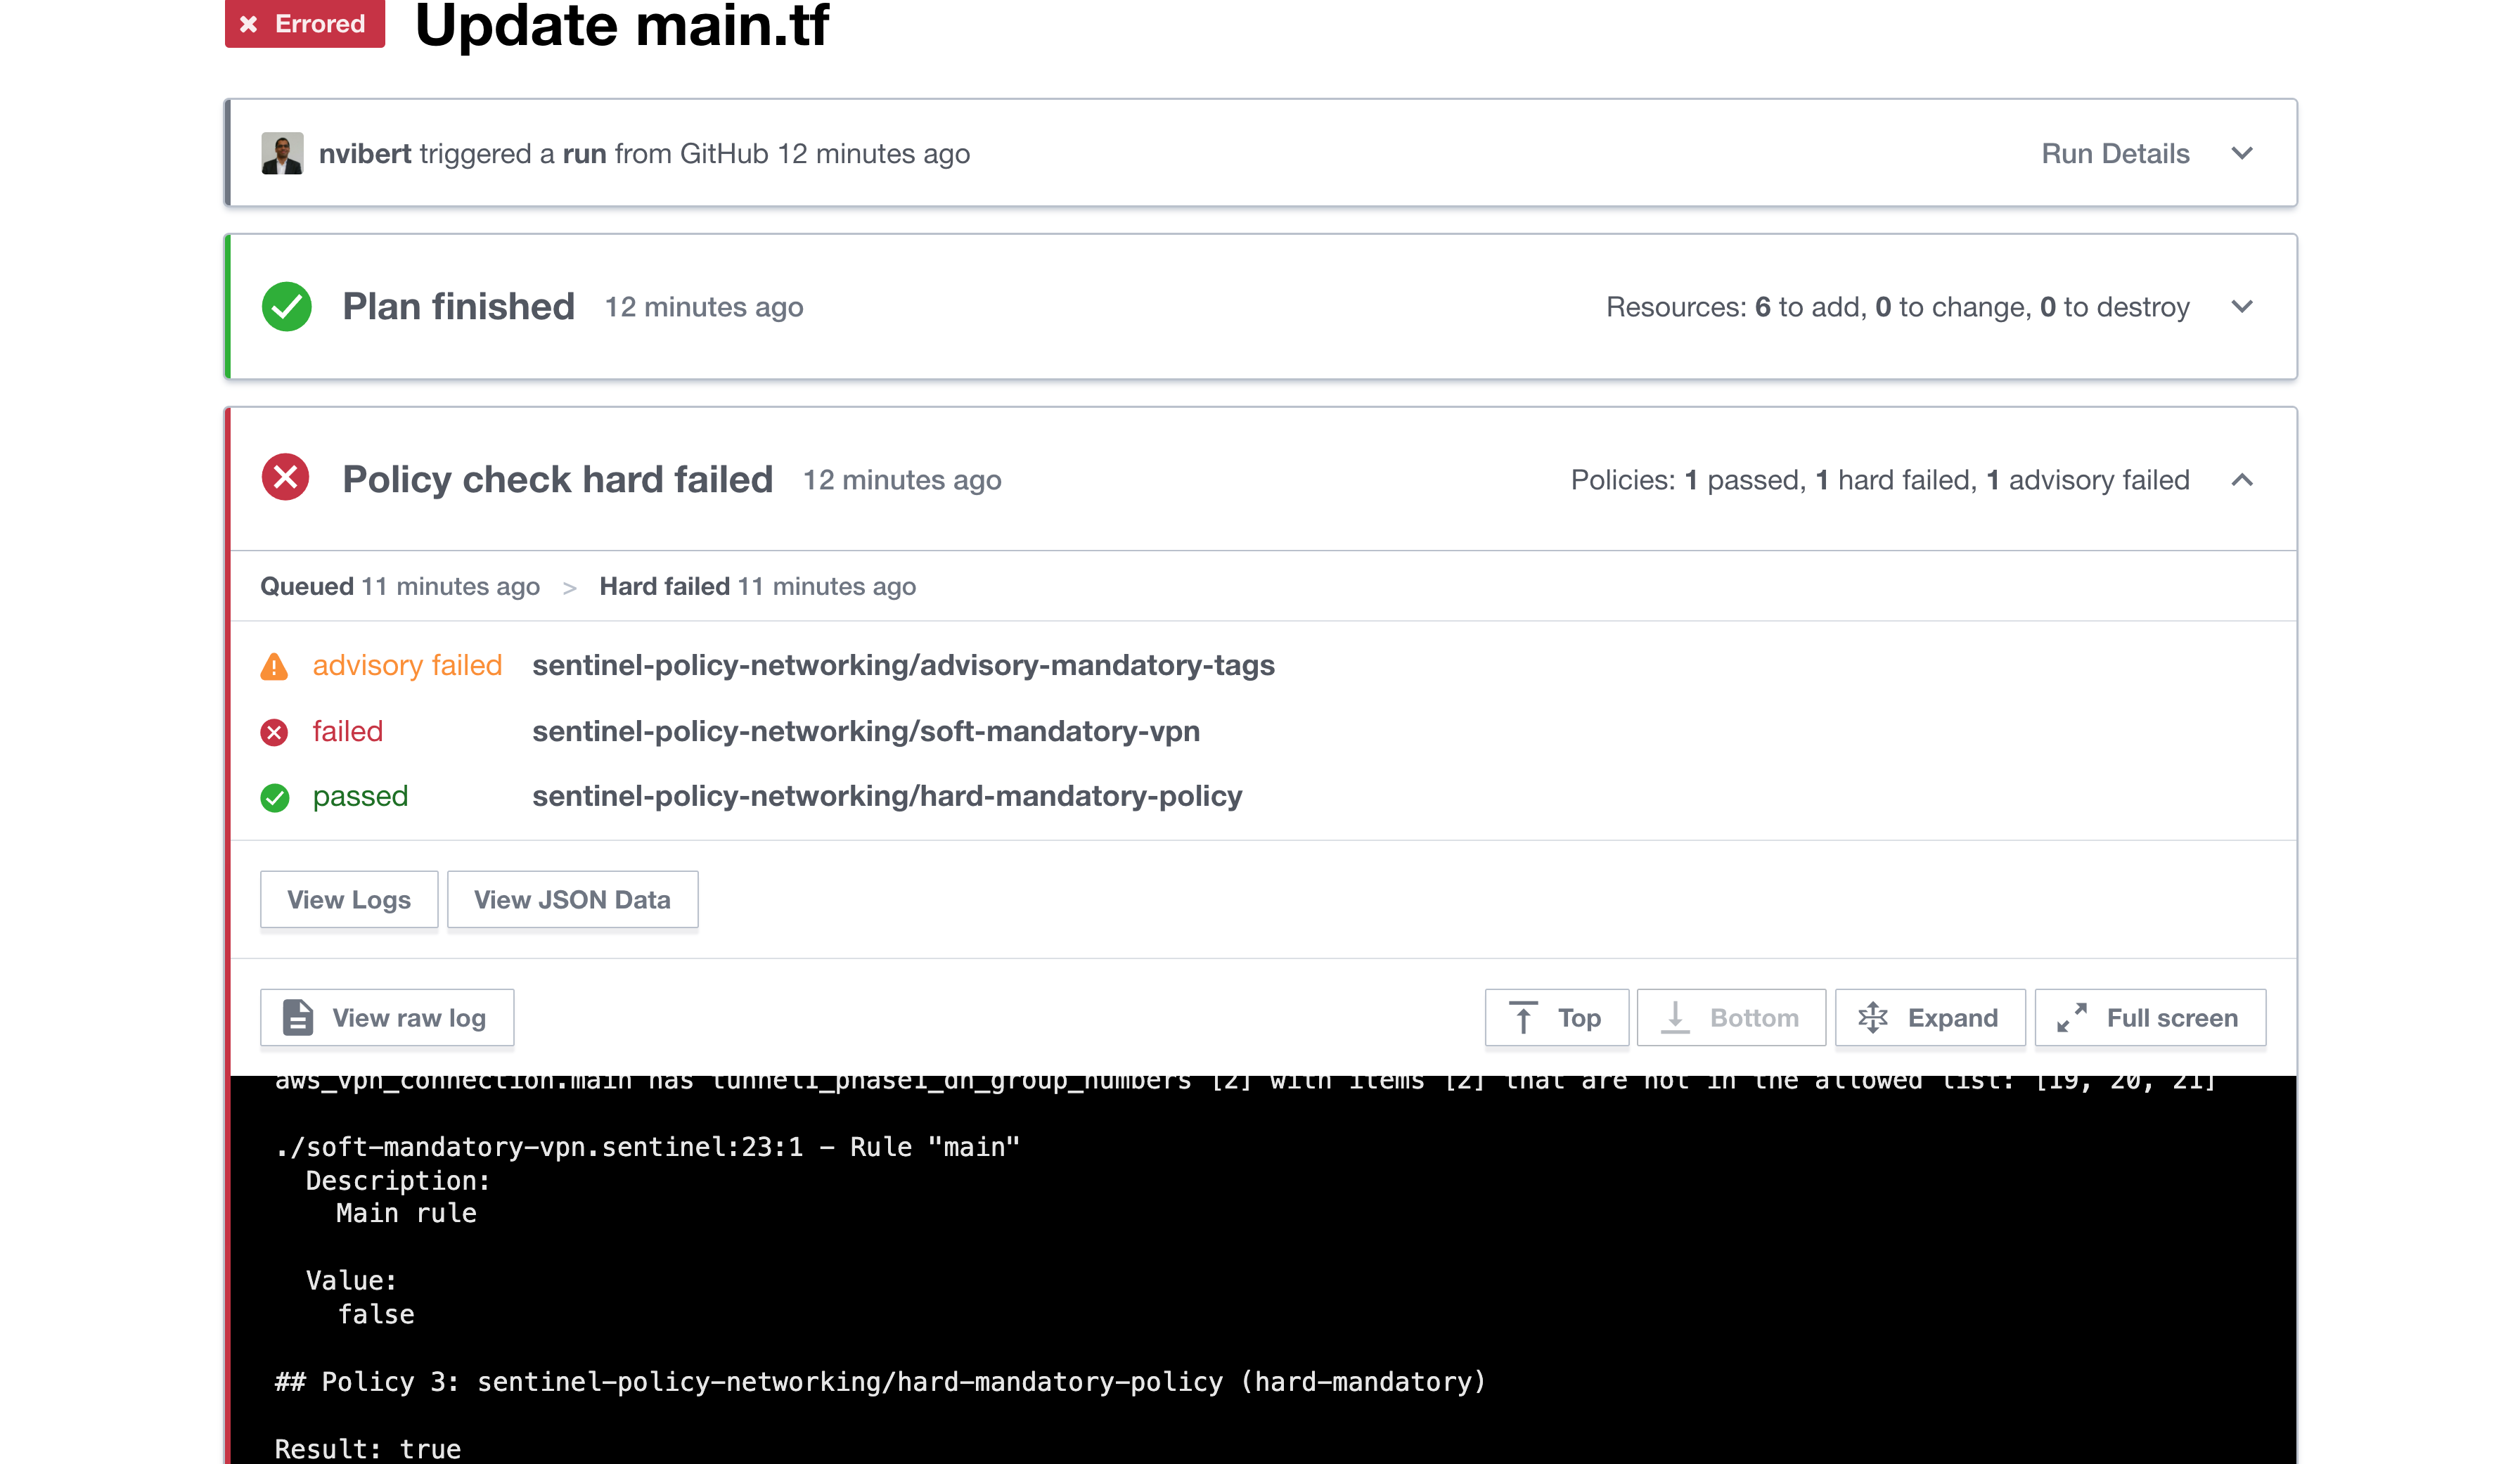
For this following run (where a Hard-Mandatory passed but where a Soft-Mandatory failed and an Advisory failed):
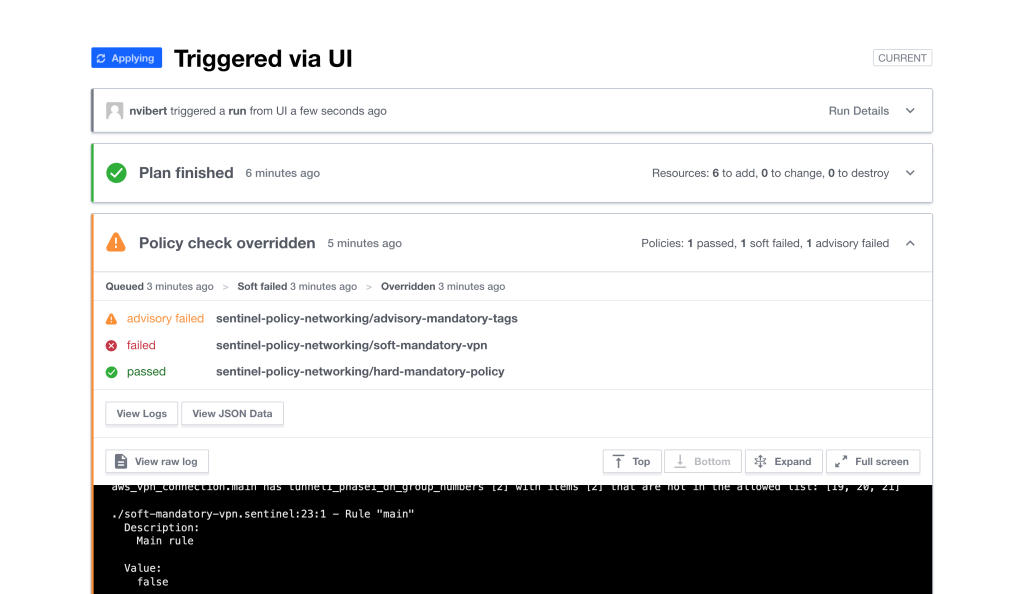
You would get the following logs:
{
    "resource": {
        "action": "soft_failed",
        "meta": {
            "result": false,
            "passed": 1,
            "total_failed": 2,
            "hard_failed": 0,
            "soft_failed": 1,
            "advisory_failed": 1,
            "duration_ms": 0,
            "sentinel": {
                "schema_version": 1,
                "data": {
                    "sentinel-policy-networking": {
                        "can_override": true,
                        "error": null,
                        "policies": [
                            {
                                "allowed_failure": true,
                                "error": null,
                                "policy": "sentinel-policy-networking/advisory-mandatory-tags",
                                "result": false,
                                "trace": {
                                    "description": "This policy uses the Sentinel tfplan/v2 import to require that\nspecified AWS resources have all mandatory tags",
                                    "error": null,
                                    "print": "aws_vpn_connection.main has tags that is missing, null, or is not a map or a list. It should have had these items: [Name]\naws_customer_gateway.customer_gateway has tags that is missing, null, or is not a map or a list. It should have had these items: [Name]\n",
                                    "result": false,
                                    "rules": {
                                        "main": {
                                            "desc": "Main rule",
                                            "ident": "main",
                                            "position": {
                                                "filename": "./advisory-mandatory-tags.sentinel",
                                                "offset": 1244,
                                                "line": 38,
                                                "column": 1
                                            },
                                            "value": false
                                        }
                                    }
                                }
                            },
                            {
                                "allowed_failure": false,
                                "error": null,
                                "policy": "sentinel-policy-networking/soft-mandatory-vpn",
                                "result": false,
                                "trace": {
                                    "description": "This policy uses the Sentinel tfplan/v2 import to require that\nAWS VPNs only used allowed DH groups",
                                    "error": null,
                                    "print": "aws_vpn_connection.main has tunnel1_phase1_dh_group_numbers [2] with items [2] that are not in the allowed list: [19, 20, 21]\n",
                                    "result": false,
                                    "rules": {
                                        "main": {
                                            "desc": "Main rule",
                                            "ident": "main",
                                            "position": {
                                                "filename": "./soft-mandatory-vpn.sentinel",
                                                "offset": 740,
                                                "line": 23,
                                                "column": 1
                                            },
                                            "value": false
                                        }
                                    }
                                }
                            },
                            {
                                "allowed_failure": false,
                                "error": null,
                                "policy": "sentinel-policy-networking/hard-mandatory-policy",
                                "result": true,
                                "trace": {
                                    "description": "This policy uses the Sentinel tfplan/v2 import to validate that no security group\nrules have the CIDR \"0.0.0.0/0\" for ingress rules.  It covers both the\naws_security_group and the aws_security_group_rule resources which can both\ndefine rules.",
                                    "error": null,
                                    "print": "",
                                    "result": true,
                                    "rules": {
                                        "main": {
                                            "desc": "",
                                            "ident": "main",
                                            "position": {
                                                "filename": "./hard-mandatory-policy.sentinel",
                                                "offset": 2136,
                                                "line": 58,
                                                "column": 1
                                            },
                                            "value": true
                                        }
                                    }
                                }
                            }
                        ],
                        "result": false
                    }
                }
            },
            "comment": null,
            "run": {
                "id": "run-qNc8gXU5fex7LiqJ",
                "message": "Triggered via UI"
            },
            "workspace": {
                "id": "ws-LvRrPmVrm4MSnDC9",
                "name": "aws-networking-sentinel-policed"
            }
        },
        "type": "policy_check",
        "id": "polchk-fUXEJ9yViKnfnyJ1"
    },
    "request": {
        "id": null
    },
    "auth": {
        "impersonator_id": null,
        "type": "Client",
        "accessor_id": "user-XcfwsoNPGCbux6wP",
        "description": "nvibert",
        "organization_id": "org-b5PqUHqMpyQ2M86A"
    },
    "timestamp": "2021-11-26T22:12:03.000Z",
    "version": "0",
    "type": "Resource",
    "id": "fc87bebb-75cd-4f18-bb48-07f20f44fb01"
}
The log will have a similar format (see this GitHub repo with the sample Sentinel audit logs) for a Hard-Mandatory policy check fail like below:
Obviously these logs are verbose JSON files and are hard to read, which is why we need to write the right search queries to build dashboards.
Here are two relevant search queries and results (we’ll look at how I built them in the last section of this post):
source="terraform_cloud" sourcetype="terraform_cloud" resource.action = "overridden"
| table resource.meta.run.id resource.meta.run.message resource.meta.workspace.name resource.meta.comment auth.description timestamp
| rename resource.meta.run.id AS "Run ID",
    resource.meta.run.message AS "Run Comment",
    resource.meta.workspace.name AS "Workspace",
    resource.meta.comment AS "Override Message",
    auth.description AS Approver,
    timestamp AS Time
It goes a bit beyond the example in Kyle’s blog: it shows you all the runs that were overriden, in which workplaces and the messages for the runs and for the override.

Another example is this query:
source="terraform_cloud" sourcetype="terraform_cloud" resource.action="hard_failed"
| spath resource.meta.run.id output=Run
| spath auth.description output=User
| spath resource.meta.sentinel.data.sentinel-policy-networking.policies{} output=policies
| mvexpand policies
| spath input=policies trace.rules.main.position.filename output=filename
| spath input=policies result output=value
| where value="false" AND match(filename,"^\..hard")
| spath input=policies trace.print output=error_message
| rename filename AS Policy, error_message AS Log, timestamp AS Time
| table User Run Time Policy Log
It’s pretty handy. For a specific policy-set (sentinel-policy-networking), it gives me all the runs that failed the hard-policy check, which specific policy failed and the log messages.

Building Search Queries
My explanation of Splunk is unlikely to be entirely convincing. Apologies in advance to any Splunk enthusiasts when I use the wrong terms.
In essential, we are trying to extract relevant fields and statistics out of the index (the collection of data and logs that Splunk will filter). We are going to use queries to narrow down the index to get exactly what we want.
Let’s look at the couple of search queries we used earlier:
source="terraform_cloud" sourcetype="terraform_cloud" resource.action = "overridden"
| table resource.meta.run.id resource.meta.run.message resource.meta.workspace.name resource.meta.comment auth.description timestamp
| rename resource.meta.run.id AS "Run ID",
    resource.meta.run.message AS "Run Comment",
    resource.meta.workspace.name AS "Workspace",
    resource.meta.comment AS "Override Message",
    auth.description AS Approver,
    timestamp AS Time
For the first one above, we filter all the Terraform Cloud logs where the action field is set to “overridden”. That limits the results to three logs (and three associated runs).
Then we take the result and we display it in a table, again extracting the values from the audit log. We go and fetch the value nested in the log JSON.
resource.meta.workspace.name will return the value of “aws-networking-sentinel-policied” for the following log:
{
    "resource": {
        "action": "overridden",
        "meta": {
            "comment": "OK",
            "run": {
                "id": "run-KQ52SHKWgAGW8ZsK",
                "message": "Update main.tf"
            },
            "workspace": {
                "id": "ws-LvRrPmVrm4MSnDC9",
                "name": "aws-networking-sentinel-policed"
            }
        },
        "type": "policy_check",
        "id": "polchk-ZKR9BeAkP61Ri82h"
    },
    "request": {
        "id": null
    },
    "auth": {
        "impersonator_id": null,
        "type": "Client",
        "accessor_id": "user-XcfwsoNPGCbux6wP",
        "description": "nvibert",
        "organization_id": "org-b5PqUHqMpyQ2M86A"
    },
    "timestamp": "2021-11-28T17:25:36.000Z",
    "version": "0",
    "type": "Resource",
    "id": "085f4d05-67c0-4214-bb60-ad872f184155"
}
We also renamed the table headers and that’s it! We’ve got our table.
This one is admittedly simple. The one below was a bit harder and I needed some help from Splunk specialists with it.
source="terraform_cloud" sourcetype="terraform_cloud" resource.action="hard_failed"
| spath resource.meta.run.id output=Run
| spath auth.description output=User
| spath resource.meta.sentinel.data.sentinel-policy-networking.policies{} output=policies
| mvexpand policies
| spath input=policies trace.rules.main.position.filename output=filename
| spath input=policies result output=value
| where value="false" AND match(filename,"^\..hard")
| spath input=policies trace.print output=error_message
| rename filename AS Policy, error_message AS Log, timestamp AS Time
| table User Run Time Policy Log
Here again, we filter based on the runs that failed the policy check for policies with Hard Mandatory enforcements.
We then use spath which is to extract information from a structured data like JSON. Again, it helps us pull nested information from the JSON. We output as another field, which we will use in our final table.
This highlighted command below will extract all the results from this particular policy set called sentinel-policy-networking. I am sure there are ways to do it across multiple policy sets but I haven’t quite worked out how to do that yet.
spath resource.meta.sentinel.data.sentinel-policy-networking.policies{} output=policies
Now, up to line 4 above (included), I’ve got a log per “hard_failed” run but with the 3 policies results nested in the log. I want to break it up into 3 logs instead of one so that I can apply some logic to it.

The command for this is “mvexpand“. Mvexpand expands the values in a multivalue field into separate events – perfect!
When I use mvexpand, I can break up the nested logs above as three separate events with a singe policy result instead:

I then filter with a simple WHERE condition the policies which begin with “hard” (all my hard mandatory policies are named that way) and which failed (value = “false”). That tells me exactly which are the policies that failed the check.
I then display the results on a pretty table and rename the fields as required.
So hopefully you can start seeing how useful Splunk is with Terraform; especially when you need to auditing your Sentinel policies.
What’s even cooler is to build your Splunk dashboards with Terraform to monitor Terraform. That’s what we will be doing in Part 3.

2 thoughts on “Terraform and Splunk Part 2: Setting up Splunk Dashboards and Searches with Terraform”