Regardless of which networking platform you are using (traditional hardware-based Cisco platform, virtual networking like NSX, cloud networking in AWS or Azure or cloud native networking like Cilium), you’re going to need to monitor the health of your underlying networking platform.
For Cilium, it’s natural we’d be using open-source and cloud-native platforms like Prometheus (time-series database) and Grafana (metrics visualization platform) to scrape all the relevant metrics out of Cilium and Hubble and to display them in pretty dashboards.

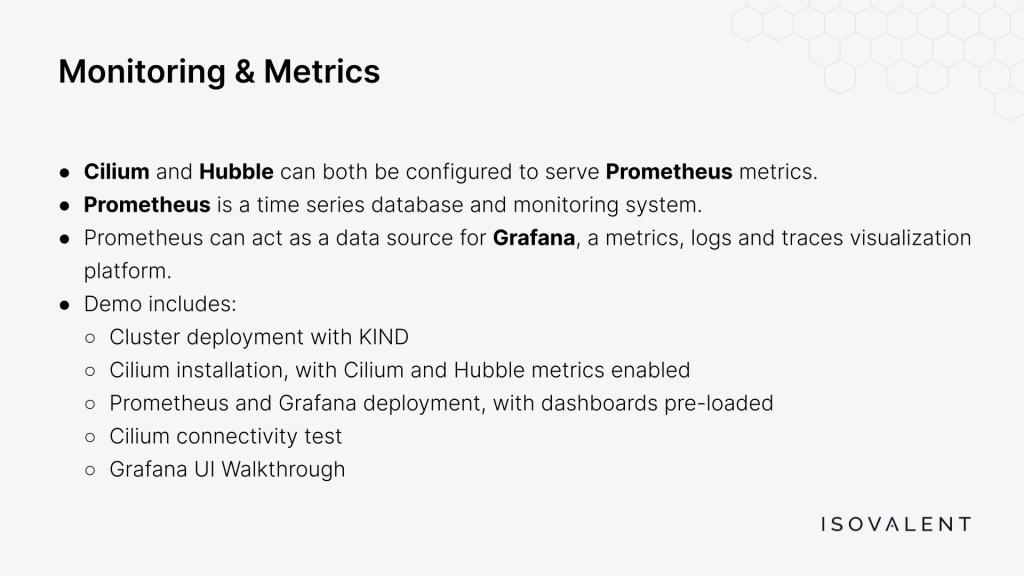
In the demo I recorded below:
- I start by deploying a Kubernetes cluster using Kind.
- I then install Cilium, while making sure the metrics are enabled for Prometheus to export.
- I deploy an installation of Prometheus and Grafana, with pre-loaded dashboards to visualize key metrics for Cilium and Hubble.
- I ran a Cilium Connectivity Test to generate some data.
- I finish by walking through briefly the Grafana UI and the dashboards.
Despite my own limited experience with Grafana, it was surprisingly simple to get this working. What I’d like to do next is to look at more advanced use cases with Grafana (using some of the advanced alerting for example) and visualize various applications and scenarios (for example, by using Cilium Service Mesh).
That’s for another time though.
Thanks for reading.
