
About 3 years ago, VMware acquired a cloud-hosted monitoring and analytics platform named Wavefront. With Wavefront, you could send time-series data from anywhere – applications, containers, serverless platforms, etc… – and render charts and get some analytics and insights.
Naturally, I got my hands on it as soon as I could and started playing with it. This LinkedIn post from almost 3 years ago shows my first experiment with it:
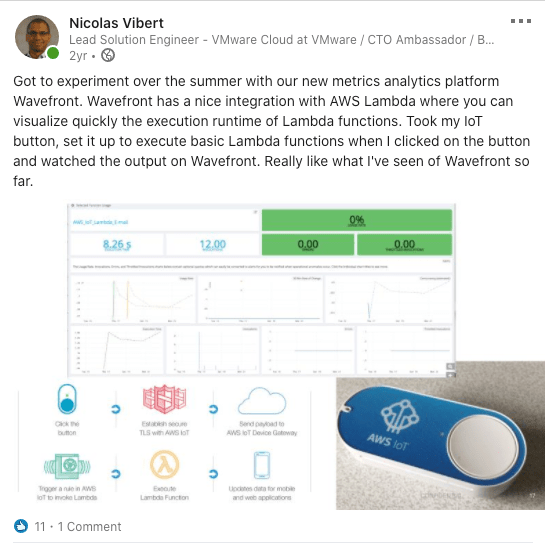
At the time, I was experimenting with AWS Lambda and the IoT button – and the execution of Lambda functions triggered by pressing on the AWS button.
At a VMUG a couple of years later, I used that AWS IoT button to add hosts to my VMware Cloud on AWS SDDC (using scripts written by Matt Dreyer and Oren Root, to give credit where due). The IoT button was for me the easiest way to grasp what Serverless was – trigger the execution of some code based on an event (in this case, the event was a physical action: pressing a button).
Anyway, back to Wavefront – while it went a bit under the radar since the acquisition, it turns out it’s being used at scale by operators that need to understand application and infrastructure performance. That includes the VMware team supporting VMware Cloud on AWS operations – they use it extensively (read more here).
I recently got another reason to use Wavefront – since rebranded to VMware Tanzu Observability by Wavefront as it falls under our Cloud Native Application umbrella – and it goes back to the work I started with British Heart Foundation around monitoring Air Quality.
Read the initial blog post on setting up a Raspberry Pi to monitor Air Quality.
If you read the post before, you can see I am collecting Air Quality (AQ) data from a sensor directly attached to a Raspberry Pi. I had previously uploaded the data onto a dashboard called Adafruit. While it worked fine, it’s nowhere near as sophisticated as what we can do with Wavefront.
Setting up Wavefront
I set out to send the AQ data collected from the Raspberry Pi to get them displayed on a Wavefront dashboard. To get the data from the Pi to the Cloud-hosted Wavefront portal, you can either send it directly (Direct Data Ingestion) or via a Wavefront proxy.
Wavefront actually recommends the data is sent not directly to the Wavefront SaaS portal but via a proxy.
Clement Pang, who co-founded Wavefront, explained why you should use a proxy in this video.
The Wavefront Proxy is an open-source piece of software that can be deployed on Linux, Mac, Windows or as a Docker container and can be deployed on-prem or in the Cloud. Typically the proxy would be deployed in some kind of DMZ: applications that cannot directly connect to the Internet would send their data to the proxy and the proxy would then upload it to Wavefront over the Internet.
I played with both options: deploying in a Docker container on my Mac and as an EC2 instance:

Eventually I picked an EC2 instance (a cheap t2.micro) and deployed the proxy. It was actually a single command to deploy it and the instructions you get on the Wavefront UI are pretty straight-forward:

On my EC2 Amazon Linux instance, I ran the command (see highlighted lines). I’ve hidden the API token but that’s essentially how we authenticate and secure the communications from the proxy to the Wavefront portal.
[ec2-user@ip-172-31-31-101 ~]$ sudo bash -c "$(curl -sL https://wavefront.com/install)" -- install \
>     --proxy \
>     --wavefront-url https://vmware.wavefront.com \
>     --api-token aaaaa-bbbbbb-cccccc-ddddddd-eeeeeeee
Detecting operating system:
RedHat/CentOS
Checking installation privileges
Python detected in /bin/python
which: no pip in (/sbin:/bin:/usr/sbin:/usr/bin)
Pip is not installed, installing Pip.
Wavefront CLI detected in /usr/bin/wave

         __      __                     _____                      __
        /  \    /  \_____ ___  __ _____/ ____\______  ____   _____/  |_
        \   \/\/   /\__   \  \/ // __ \   __\ _  __ \/  _ \ /    \   __
         \        /  / __  \   /\  ___/|  |   |  | \(  <_> )   |  \  |
          \__/\  /  (____  /\_/  \___  >__|   |__|   \____/|___|  /__|
               \/        \/          \/                         \/


Validating API Token using Wavefront URL:  https://vmware.wavefront.com
Successfully validated token.
Successfully validated token.
Starting Wavefront Proxy Installation!
Detected  Amazon Linux
Detected operating system as amzn/2.
Checking for curl...
Detected curl...
Downloading repository file: https://packagecloud.io/install/repositories/wavefront/proxy/config_file.repo?os=amzn&dist=2&source=script
done.
Installing pygpgme to verify GPG signatures...
Loaded plugins: extras_suggestions, langpacks, priorities, update-motd
wavefront_proxy-source/signature                                                                                                                          |  819 B  00:00:00
Retrieving key from https://packagecloud.io/wavefront/proxy/gpgkey
Importing GPG key 0xA6A9D323:
 Userid     : "https://packagecloud.io/wavefront/proxy (https://packagecloud.io/docs#gpg_signing) <support@packagecloud.io>"
 Fingerprint: 0627 c09c fe0b d003 dc29 4270 d009 c507 a6a9 d323
 From       : https://packagecloud.io/wavefront/proxy/gpgkey
wavefront_proxy-source/signature                                                                                                                          |  951 B  00:00:00 !!!
wavefront_proxy-source/primary                                                                                                                            |  175 B  00:00:00
Package pygpgme-0.3-9.amzn2.0.2.x86_64 already installed and latest version
Nothing to do
Installing yum-utils...
Loaded plugins: extras_suggestions, langpacks, priorities, update-motd
Package yum-utils-1.1.31-46.amzn2.0.1.noarch already installed and latest version
Nothing to do
Generating yum cache for wavefront_proxy...
Importing GPG key 0xA6A9D323:
 Userid     : "https://packagecloud.io/wavefront/proxy (https://packagecloud.io/docs#gpg_signing) <support@packagecloud.io>"
 Fingerprint: 0627 c09c fe0b d003 dc29 4270 d009 c507 a6a9 d323
 From       : https://packagecloud.io/wavefront/proxy/gpgkey
Generating yum cache for wavefront_proxy-source...

The repository is setup! You can now install packages.
Creating /etc/wavefront/wavefront-proxy/wavefront.conf from template
Creating /etc/wavefront/wavefront-proxy/preprocessor_rules.yaml from template
Creating /etc/wavefront/wavefront-proxy/log4j2.xml from template
JRE not found - trying to download and install
Checking /etc/wavefront/wavefront-proxy/wavefront.conf for HTTP proxy settings
No HTTP proxy configuration detected - attempting direct download
Finished Wavefront Proxy Installation!
Starting Wavefront Proxy Configuration!
https://vmware.wavefront.com/api/
a047db89-5096-4a19-aae0-2e23a2db653f
Restarting wavefront-proxy
Stopping Wavefront Proxy
There was a problem, see /var/log/wavefront/wavefront-error.log and /var/log/wavefront/wavefront-daemon.log
Done
Starting Wavefront Proxy
Done
Finished Wavefront Proxy Configuration!
The Proxy's configuration file can be found at /etc/wavefront/wavefront-proxy/wavefront.conf
Proxy Validation
Let’s try to validate that the proxy is actually working by sending some data. I use nc (Netcat), a Linux utility for sending raw data over a network connection.
echo -e "test.nvibert 1 source=source_nvibert\n" | nc ec2-A-B-C-D.eu-west-2.compute.amazonaws.com 2878
We’re sending this data in the Wavefront Data Format:
<metricName> <metricValue> [<timestamp>] source=<source> [pointTags]
In the test above, the data I sent has the following fields:
- metricName is test.nvibert
- metricValue is 1
- timestamp is not specified so the timestamp is set to the current time at the Wavefront proxy when the metric arrives.
- source is source_nvibert – the source is the name of an application, host, container, instance, or any other unique source that is sending the metric to Wavefront.
On the Wavefront dashboard, if I look for the test.nvibert metric, I can see the 1.0 value at 3.20pm:

And my source is now listed and found within the Wavefront dashboard:

Wavefront Python Configuration
As we are using Python to collect data from the Air Quality sensor, I will use the Wavefront Python SDK to upload the AQ data.
It was very easy to set up – just run the command below to download the SDK to the Raspberry Pi:
pi@raspberrypi:~ $ pip3 install wavefront-sdk-python
Looking in indexes: https://pypi.org/simple, https://www.piwheels.org/simple
Collecting wavefront-sdk-python
Downloading https://www.piwheels.org/simple/wavefront-sdk-python/wavefront_sdk_python-1.6.3-py3-none-any.whl
Requirement already satisfied: requests>=2.18.4 in /usr/lib/python3/dist-packages (from wavefront-sdk-python) (2.21.0)
Collecting tdigest>=0.5.2 (from wavefront-sdk-python)
Using cached https://files.pythonhosted.org/packages/32/72/f420480118cbdd18eb761b9936f0a927957130659a638449575b4a4f0aa7/tdigest-0.5.2.2-py2.py3-none-any.whl
Collecting pyudorandom (from tdigest>=0.5.2->wavefront-sdk-python)
Downloading https://www.piwheels.org/simple/pyudorandom/pyudorandom-1.0.0-py3-none-any.whl
Collecting accumulation-tree (from tdigest>=0.5.2->wavefront-sdk-python)
Downloading https://www.piwheels.org/simple/accumulation-tree/accumulation_tree-0.6-cp37-cp37m-linux_armv7l.whl (296kB)
100% |████████████████████████████████| 296kB 1.2MB/s
Installing collected packages: pyudorandom, accumulation-tree, tdigest, wavefront-sdk-python
Successfully installed accumulation-tree-0.6 pyudorandom-1.0.0 tdigest-0.5.2.2 wavefront-sdk-python-1.6.3
I will also need the Python timestamp to timestamp the data (it’s required with the Wavefront command wavefront_sender.send_metric).
This is my final configuration to stream my Air Quality data into Wavefront:
import serial, time
from time import gmtime, strftime
from datetime import datetime

ser = serial.Serial('/dev/ttyUSB0')


from wavefront_sdk import WavefrontProxyClient
wavefront_sender = WavefrontProxyClient(
   host="ec2-A-B-C-D.eu-west-2.compute.amazonaws.com",
   metrics_port=2878,
   distribution_port=2878,
   tracing_port=30000,
)

while True:
	now = datetime.now()
	timestamp_nico = datetime.timestamp(now)
	print("timestamp =", timestamp_nico)
	data = []
	for index in range(0,10):
		datum = ser.read()
		data.append(datum)

	pmtwofive = int.from_bytes(b''.join(data[2:4]), byteorder='little') / 1
0
	print(pmtwofive)
	wavefront_sender.send_metric(name="nvibert.pm2.5", value=pmtwofive, tim
estamp=timestamp_nico, tags={"city": "manchester"}, source="nvibert_rapsberrypi"
)
	print(strftime("%Y-%m-%d %H:%M:%S", gmtime()))
	pmten = int.from_bytes(b''.join(data[4:6]), byteorder='little') / 10
Let’s explain some of these commands:
from wavefront_sdk import WavefrontProxyClient
wavefront_sender = WavefrontProxyClient(
   host="ec2-A-B-C-D.eu-west-2.compute.amazonaws.com",
   metrics_port=2878,
   distribution_port=2878,
   tracing_port=30000,
)
We import the Wavefront SDK and specify the proxy details. The Python script will send the metrics data to “ec2-A-B-C-D.eu-west-2.compute.amazonaws.com” over port 2878.
wavefront_sender.send_metric(name="nvibert.pm2.5", value=pmtwofive, tim
estamp=timestamp_nico, tags={"city": "manchester"}, source="nvibert_rapsberrypi"
)
With the command above, I send the PM 2.5 (Air Quality data), timestamped with “timestamp_nico” (defined previously in the script), tagged with my location and with the data source name (the name of the Raspberry Pi, to distinguish from other sources).
Once the file is saved, I just need to run it:
python3 /home/pi/airqualitywavefront2.py
Every 10 seconds, I print on the terminal the value of my AQ:
Let’s do it live! When I run the Python command above, let’s see the data being sent to Wavefront (via the proxy, not displayed on the video below). On the left-hand side, I’ve got my Rapsberry Pi (accessed remotely via VNC Connect). Once I start running the Python code, you can see the AQ and the timestamp displayed and how, almost immediately, it is displayed on the dashboard.
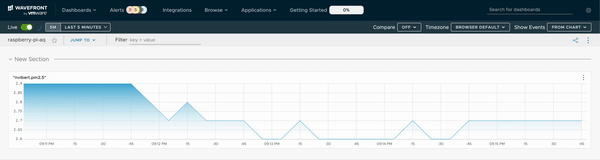
You can see my extract of my dashboard here and the decent air quality outside my house (PM2.5 value oscillating between 4 and 5.5). There are lots of things you can do it from here (understand anomalies in the values, understand patterns, etc…).

Before I conclude this post… if you are interested in this project, drop me a Tweet. It would be great to get more Air Quality data from across the world onto the dashboard (I will make it public once I know how to!).
Thanks for reading!

2 thoughts on “Data Analytics with VMware Tanzu Observability by Wavefront”