
I recently had the opportunity to work on a project with British Heart Foundation to reduce heart and lungs diseases through technology. The team I worked with focused on air quality. It has no obvious link with my day job at VMware but it has been a great experience so far and it has finally given me an excuse to invest into a Raspberry Pi.
That’s indeed how I am going to measure air quality: with a Raspberry Pi with an Air Quality sensor. I came across a great tutorial on the Raspberry Pi own website and that’s what I followed.
Choice of Raspberry Pi
I went for a Raspberry Pi 4 Model B with 4 GB of RAM. I could have gone with a much cheaper or older version but I also have other projects for the RPi (such as running the VMware ESXi hypervisor on it).
I took the easy way in and purchased the LABISTS Raspberry Pi. That includes a fan, some heatsinks, a couple of Micro HDMI to HDMI Cables and a SD Card prebooted with an operating system. So far, it’s been very good.
Opening the box and wow – it is really small. This Raspberry Pi 4 Model B comes with an Ethernet port, a Wi-Fi antenna, 2 USB-2 ports and 2 USB-3 ports.

I inserted the SD-Card, my USB mouse and keyboard, the monitor and finally the power and in minutes, I was good to go:

I had a little look around the Raspberry Pi and familiarized myself with the user interface. I connected the Raspberry Pi to my Wi-Fi network.
Unrelated to the Air Quality sensor but I came across an issue with the Raspberry Pi 4 where Wi-Fi access breaks when using channel 1 on 2.4GHz AND connecting it to a 2,560 x 1,440 resolution screen. Once I re-scan my Wireless network on my router, it picked up a different channel and Wi-Fi immediately started working again.
Once Internet access started working fine, I then started checking out the Air Quality sensor.
Air Quality Sensor
I contemplated multiple sensors – such as the ones on Pimoroni – but settled on the SDS-011 sensor ; mostly because from what I’ve read, its results were pretty reliable for such a low-cost item (£25 / $30). It’s not going to give us the most precise results (especially in humid weathers) but that’s OK – it’s acceptable for qualitative data.
The sensor provides a PM2.5 value. PM2.5 refers to atmospheric particulate matter (PM) that have a diameter of less than 2.5 micrometers.
PM2.5 seems to be a commonly accepted indicator of air quality. The World Heath Organization guideline stipulates that PM2.5 should not exceed 10 μg/m3 annual mean, or 25 μg/m3 24-hour mean.
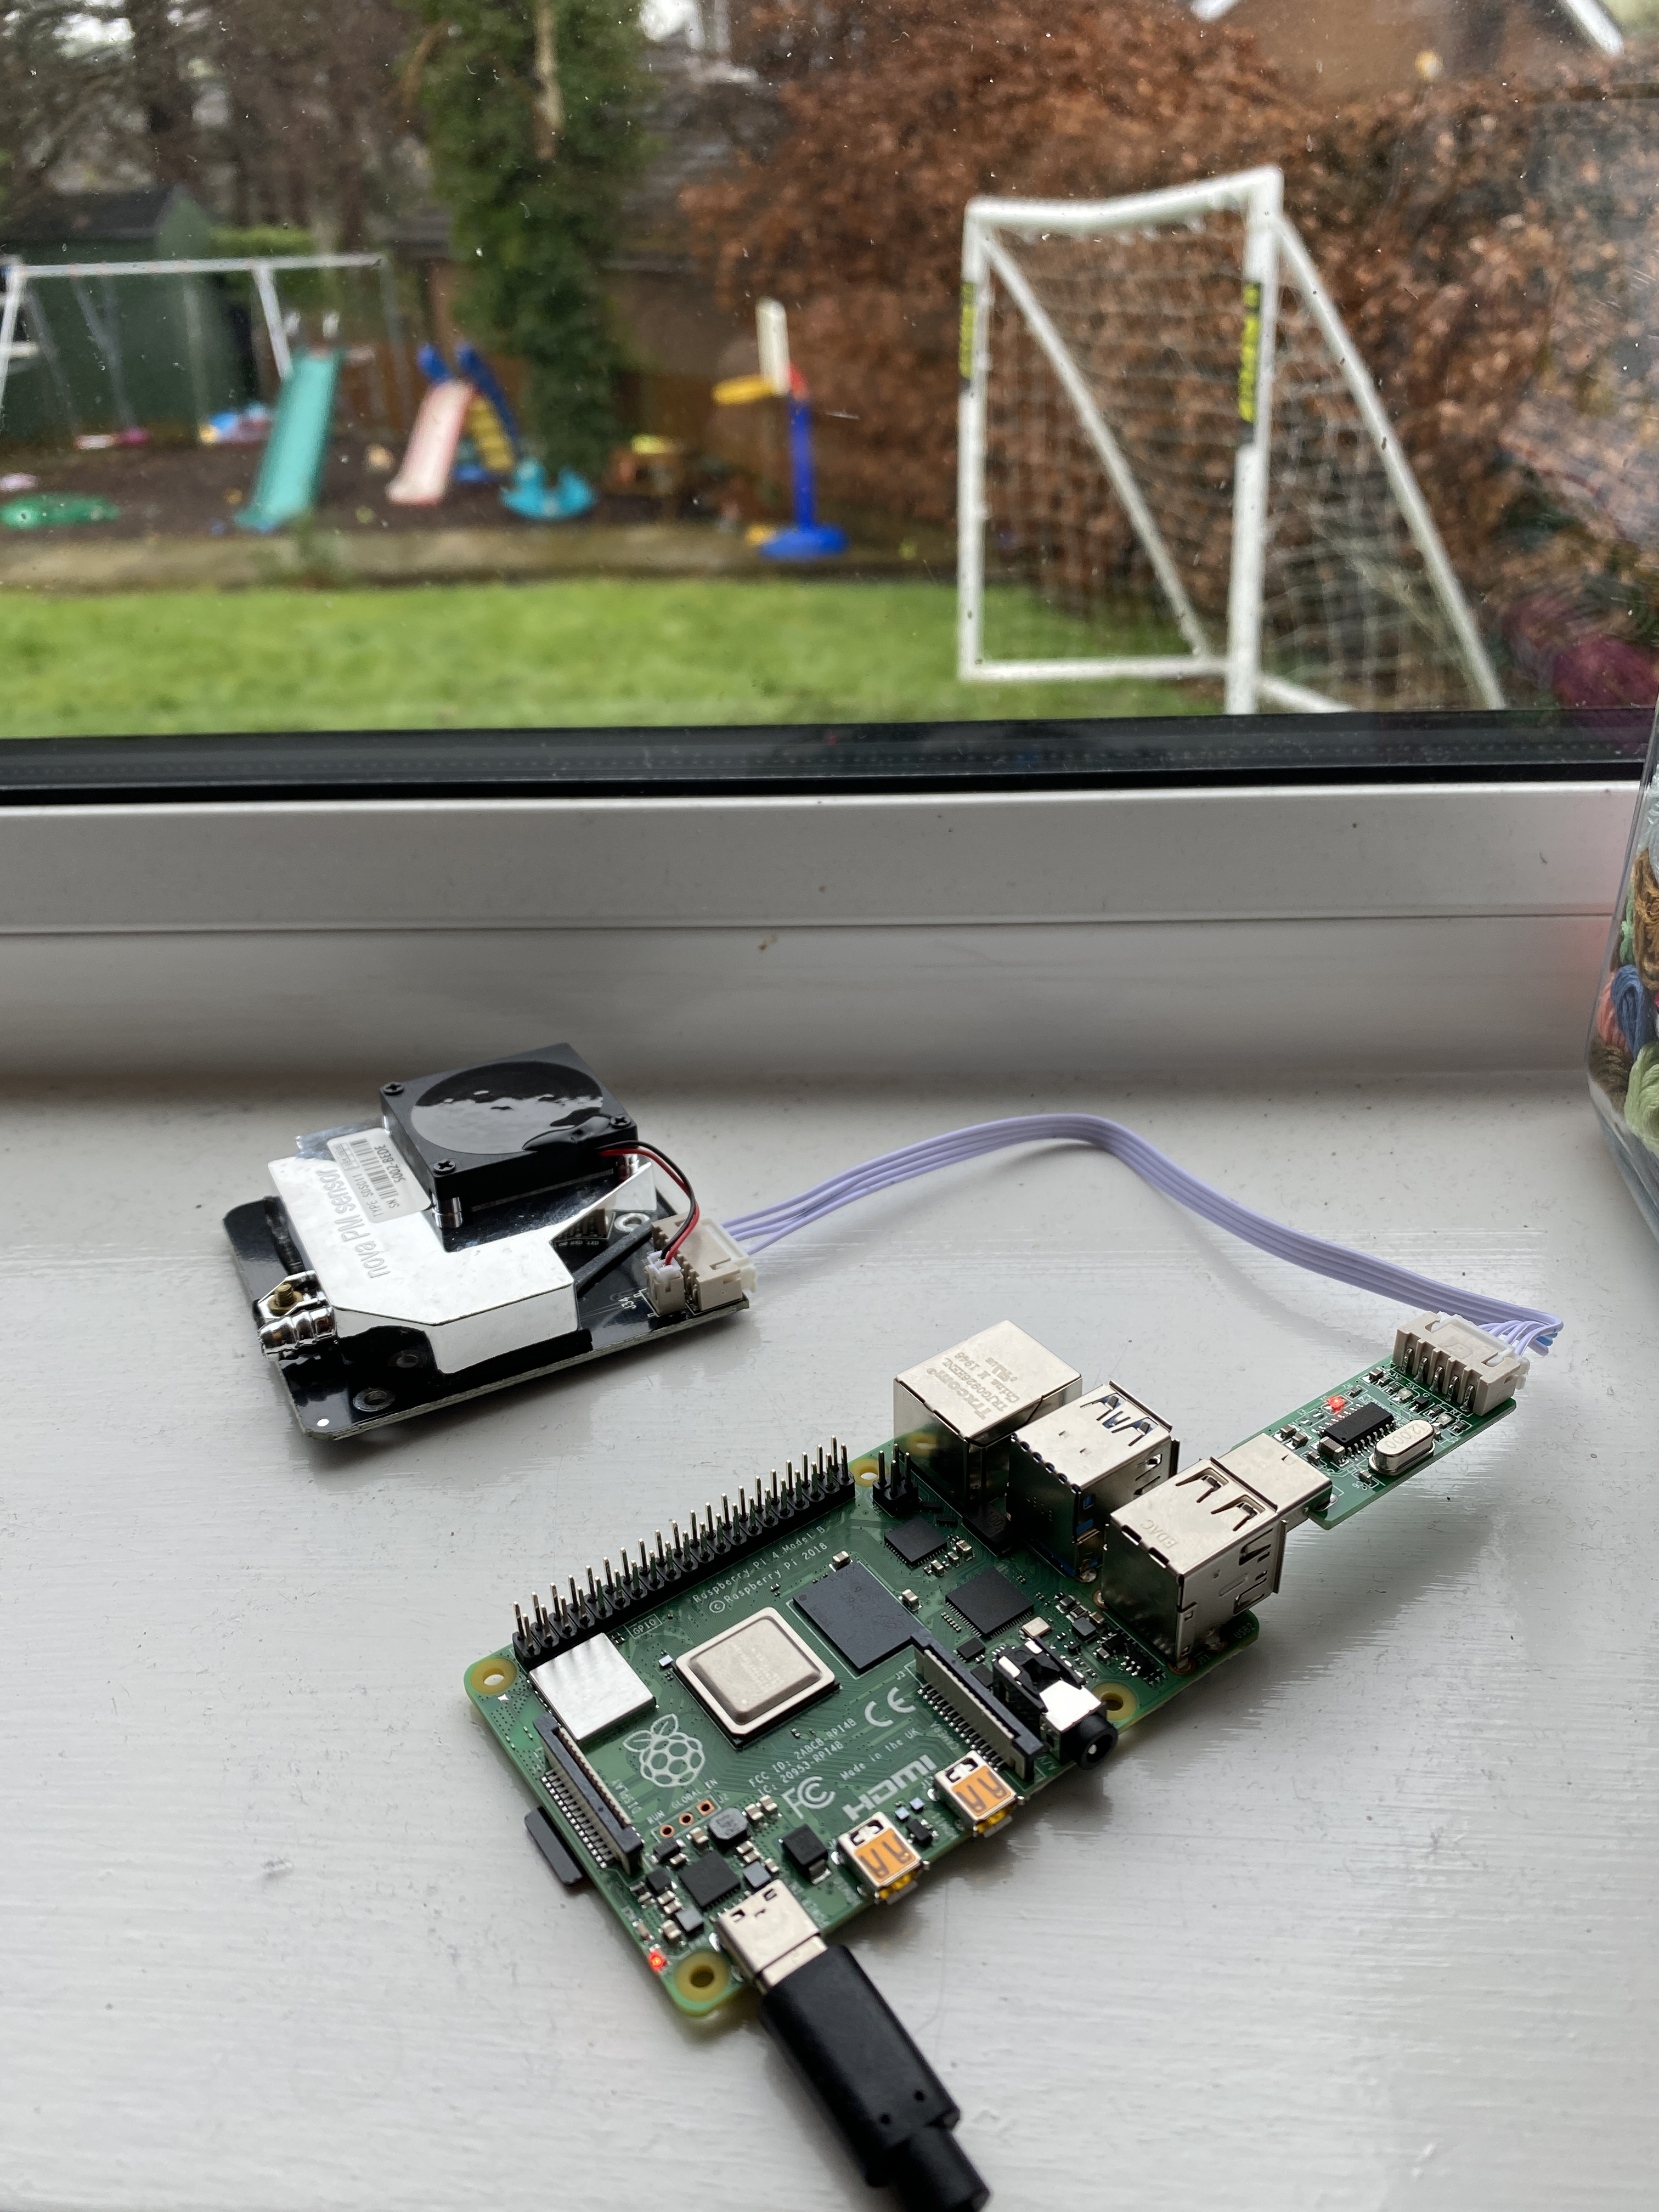
In the picture below, you can see how I plugged the sensor into the Pi’s USB port via the serial-to-USB adaptor (the adaptor came with the sensor).
The way to collect data from the sensor is using Python.
Let’s get started with setting up the Python script. First, we must install the right module. Pyserial is already installed as you can see below but adafruit-io needs installing.
pip3 is a Python package installer that will download Python packages from the Internet.
pi@raspberrypi:~ $ pwd
/home/pi
pi@raspberrypi:~ $ pip3 install pyserial
Looking in indexes: https://pypi.org/simple, https://www.piwheels.org/simple
Requirement already satisfied: pyserial in /usr/lib/python3/dist-packages (3.4)
pi@raspberrypi:~ $ pip3 install adafruit-io
Looking in indexes: https://pypi.org/simple, https://www.piwheels.org/simple
Collecting adafruit-io
  Downloading https://www.piwheels.org/simple/adafruit-io/adafruit_io-2.4.0-py3-none-any.whl
Collecting paho-mqtt (from adafruit-io)
  Downloading https://www.piwheels.org/simple/paho-mqtt/paho_mqtt-1.5.0-py3-none-any.whl (61kB)
    100% |████████████████████████████████| 61kB 1.7MB/s
Requirement already satisfied: requests in /usr/lib/python3/dist-packages (from adafruit-io) (2.21.0)
Installing collected packages: paho-mqtt, adafruit-io
Successfully installed adafruit-io-2.4.0 paho-mqtt-1.5.0
First thing you might want to check: once I have plugged in my USB-Serial adapter plugged into the RS232 adapter of the sensor and connected the USB end of the USB-Serial adapter into the Raspberry Pi’s USB Port, I want to make sure the reference is correct. The command below will tell me that the adapter is plugged into ttyUBS0. I will need the value in my Python file.
pi@raspberrypi:~ $ dmesg | grep tty
[    4.862121] usb 1-1.3: ch341-uart converter now attached to ttyUSB0
Finally, I can create the Python file. Here is my edited one. You will need to update the file below with your own AIO username, AIO key and AIO feed names. I will explain how to get these shortly.
pi@raspberrypi:~ $ more airquality.py
import serial, time
from Adafruit_IO import Client
aio = Client ('AIO_user_name', 'AIO_key')

ser = serial.Serial('/dev/ttyUSB0')

while True:
	data = []
	for index in range(0,10):
		datum = ser.read()
		data.append(datum)

	pmtwofive = int.from_bytes(b''.join(data[2:4]), byteorder='little') / 10
	aio.send('air-quality-pm-2-5', pmtwofive)
	pmten = int.from_bytes(b''.join(data[4:6]), byteorder='little') / 10
	aio.send('AIO_feed_name_2', pmten)
	time.sleep(10)

pi@raspberrypi:~ $ python3 airquality.py
The code is well explained on the Raspberry Pi blog post. Here are a couple of things worth clarifying:
- You will need an AdaFruit IO account. It’s free and very easy to set up. The tutorials are also pretty helpful. AdaFruit IO collects data in what they call “Feeds” and the feeds are then displayed in “Dashboards”.
- Once you have registered with AdaFruit IO, you will need to generate a key. Click on the right-hand side of the dashboard on “AIO Key”.

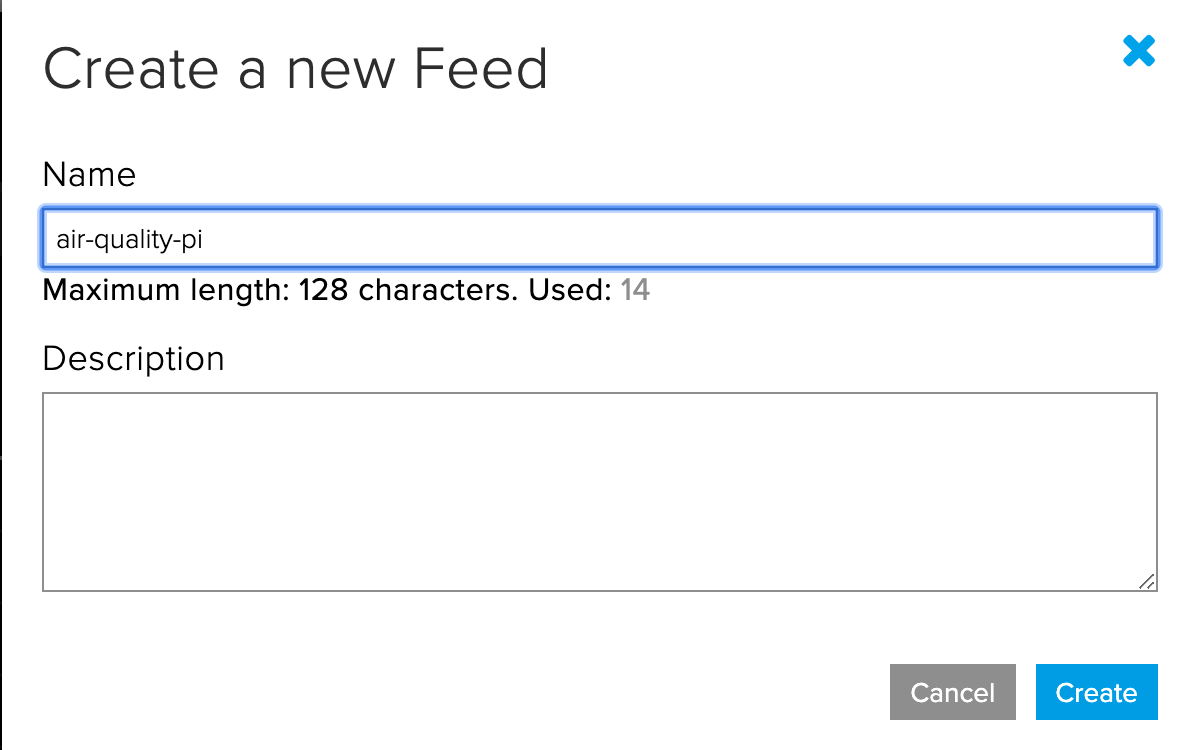
On the Adafruit IO Dashboard, create a feed and give it a name. The name will be used in the Python code highlighted above. For example, ‘air-quality-pi’ is the name of the feed.
Update the Python code above with the username, the key and the feed name.
Within minutes, you should start seeing the results on your feeds and dashboards:

The picture above is inside my office and thankfully the PM2.5 is pretty low.
Outside, the PM2.5 stays under 2.5 – pretty good but then I live in semi-rural England.

When I was finishing writing this blog post, I came across this phenomenal post written by a Python Data science expert in Chili – he goes into much more details into the process. Worth a read.
Thanks for reading!
Update 15th May 2020: if you liked this post, you might want to look at sending out the data and metrics to VMware Wavefront (also known as VMware Tanzu Observability). Check this post for more details.

Update the Python code above with the username, the key and the feed name.
Where can I do this? What line of code do I have to change?
LikeLike
Line 4 for the username and the key and line 17 for the feedname (replace AIO_user_name / AIO_key / AIO_feed_name_2).
LikeLike