
Welcome to the third post in my eBPF series: in my first post, I introduced eBPF and walked through how to use a sample code, in the second post, I talked about Cilium, an eBPF-based networking plugin for Kubernetes. In this third post, we’re going to jump straight from the previous post and leverage Cilium’s observability platform, Hubble.
One of the immediate challenges Kubernetes operators will run into is around network visibility and tracing . In many ways, the challenge was already present with standard physical machines and then with virtual ones : how do we know how these machines talk to each other?
Networkers solved the problem by adding IPFIX/Netflow in physical or virtual switches and importing these flows to a collector. That worked OK enough for a hundreds of machines – with some significant impact on the CPU of the switches traffic was traversing – but it wouldn’t scale when you deploy thousands of pods.
To extract flow data from your pods, there are options like using a service mesh or for example, using VPC Flow Logs and sending the flows to a S3 bucket and analyze the flows with Athena for example (but this is pretty complicated) and not always efficient or cost-effective.
One thing I liked about Cilium is, as it is in the datapath, it can already see all the traffic and therefore you can pretty easily derive some information out of it – with Hubble.
I found Hubble pretty cool – but actually, it’s not the only eBPF-based tool to provide network flow visibility for k8s pods. You also have Pixie, which looks equally neat.
Installing Hubble
Assuming we’ve got Cilium as our CNI plugin, we can now use its observability platform Hubble to collect some flow information.
Next, we need to enable Hubble UI, with a single command:
% cilium hubble enable --ui
🔑 Found CA in secret cilium-ca
✨ Patching ConfigMap cilium-config to enable Hubble...
♻️  Restarted Cilium pods
⌛ Waiting for Cilium to become ready before deploying other Hubble component(s)...
🔑 Generating certificates for Relay...
✨ Deploying Relay from quay.io/cilium/hubble-relay:v1.11.1...
✨ Deploying Hubble UI from quay.io/cilium/hubble-ui:v0.8.5 and Hubble UI Backend from quay.io/cilium/hubble-ui-backend:v0.8.5...
⌛ Waiting for Hubble to be installed...
✅ Hubble was successfully enabled!
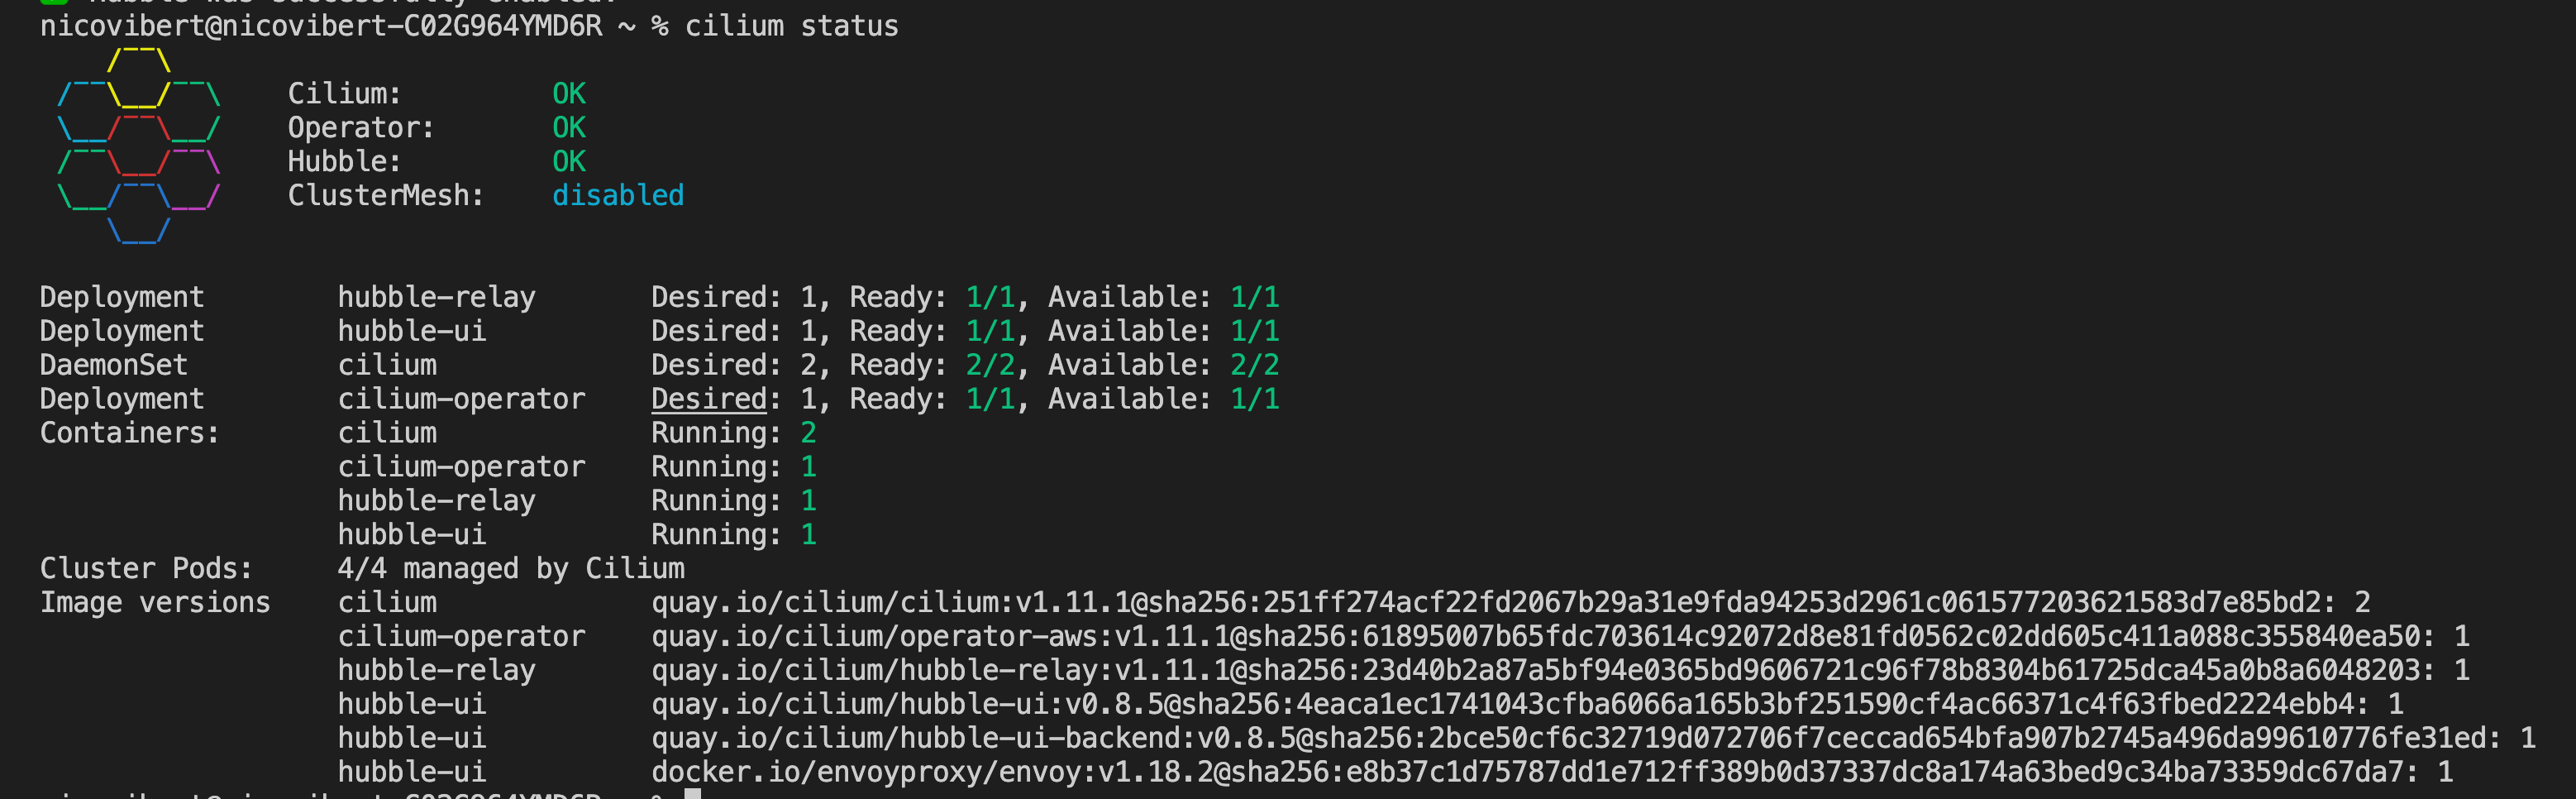
A Hubble Server runs on each node and retrieves the eBPF metrics from Cilium. The server offers a gRPC service, which means we can retrieve flow details from it with an API call. The platform that collects the flows from all the Hubble servers using gRPC is called the Hubble Relay.
The Hubble UI displays the flows as we will see shortly.
Let’s check the Cilium status again once we’ve enabled Hubble:
Accessing HubbleUI
Let’s check out the Hubble UI:
% cilium hubble ui
ℹ️  Opening "http://localhost:12000" in your browser...
It’s now up and running but we’ve got no flows:

Now, let’s generate some sample flows with the following command:
% while true; do cilium connectivity test; done
ℹ️  Monitor aggregation detected, will skip some flow validation steps
✨ [nicovibert-23189.us-west-2.eksctl.io] Creating namespace for connectivity check...
✨ [nicovibert-23189.us-west-2.eksctl.io] Deploying echo-same-node service...
✨ [nicovibert-23189.us-west-2.eksctl.io] Deploying same-node deployment...
✨ [nicovibert-23189.us-west-2.eksctl.io] Deploying client deployment...
✨ [nicovibert-23189.us-west-2.eksctl.io] Deploying client2 deployment...
✨ [nicovibert-23189.us-west-2.eksctl.io] Deploying echo-other-node service...
✨ [nicovibert-23189.us-west-2.eksctl.io] Deploying other-node deployment...
⌛ [nicovibert-23189.us-west-2.eksctl.io] Waiting for deployments [client client2 echo-same-node] to become ready...
⌛ [nicovibert-23189.us-west-2.eksctl.io] Waiting for deployments [echo-other-node] to become ready...
⌛ [nicovibert-23189.us-west-2.eksctl.io] Waiting for CiliumEndpoint for pod cilium-test/client-6488dcf5d4-f24xw to appear...
⌛ [nicovibert-23189.us-west-2.eksctl.io] Waiting for CiliumEndpoint for pod cilium-test/client2-5998d566b4-nszft to appear...
⌛ [nicovibert-23189.us-west-2.eksctl.io] Waiting for CiliumEndpoint for pod cilium-test/echo-other-node-f4d46f75b-gqnpb to appear...
⌛ [nicovibert-23189.us-west-2.eksctl.io] Waiting for CiliumEndpoint for pod cilium-test/echo-same-node-745bd5c77-5dp8w to appear...
⌛ [nicovibert-23189.us-west-2.eksctl.io] Waiting for Service cilium-test/echo-same-node to become ready...
⌛ [nicovibert-23189.us-west-2.eksctl.io] Waiting for Service cilium-test/echo-other-node to become ready...
⌛ [nicovibert-23189.us-west-2.eksctl.io] Waiting for NodePort 192.168.125.151:32399 (cilium-test/echo-same-node) to become ready...
⌛ [nicovibert-23189.us-west-2.eksctl.io] Waiting for NodePort 192.168.125.151:32328 (cilium-test/echo-other-node) to become ready...
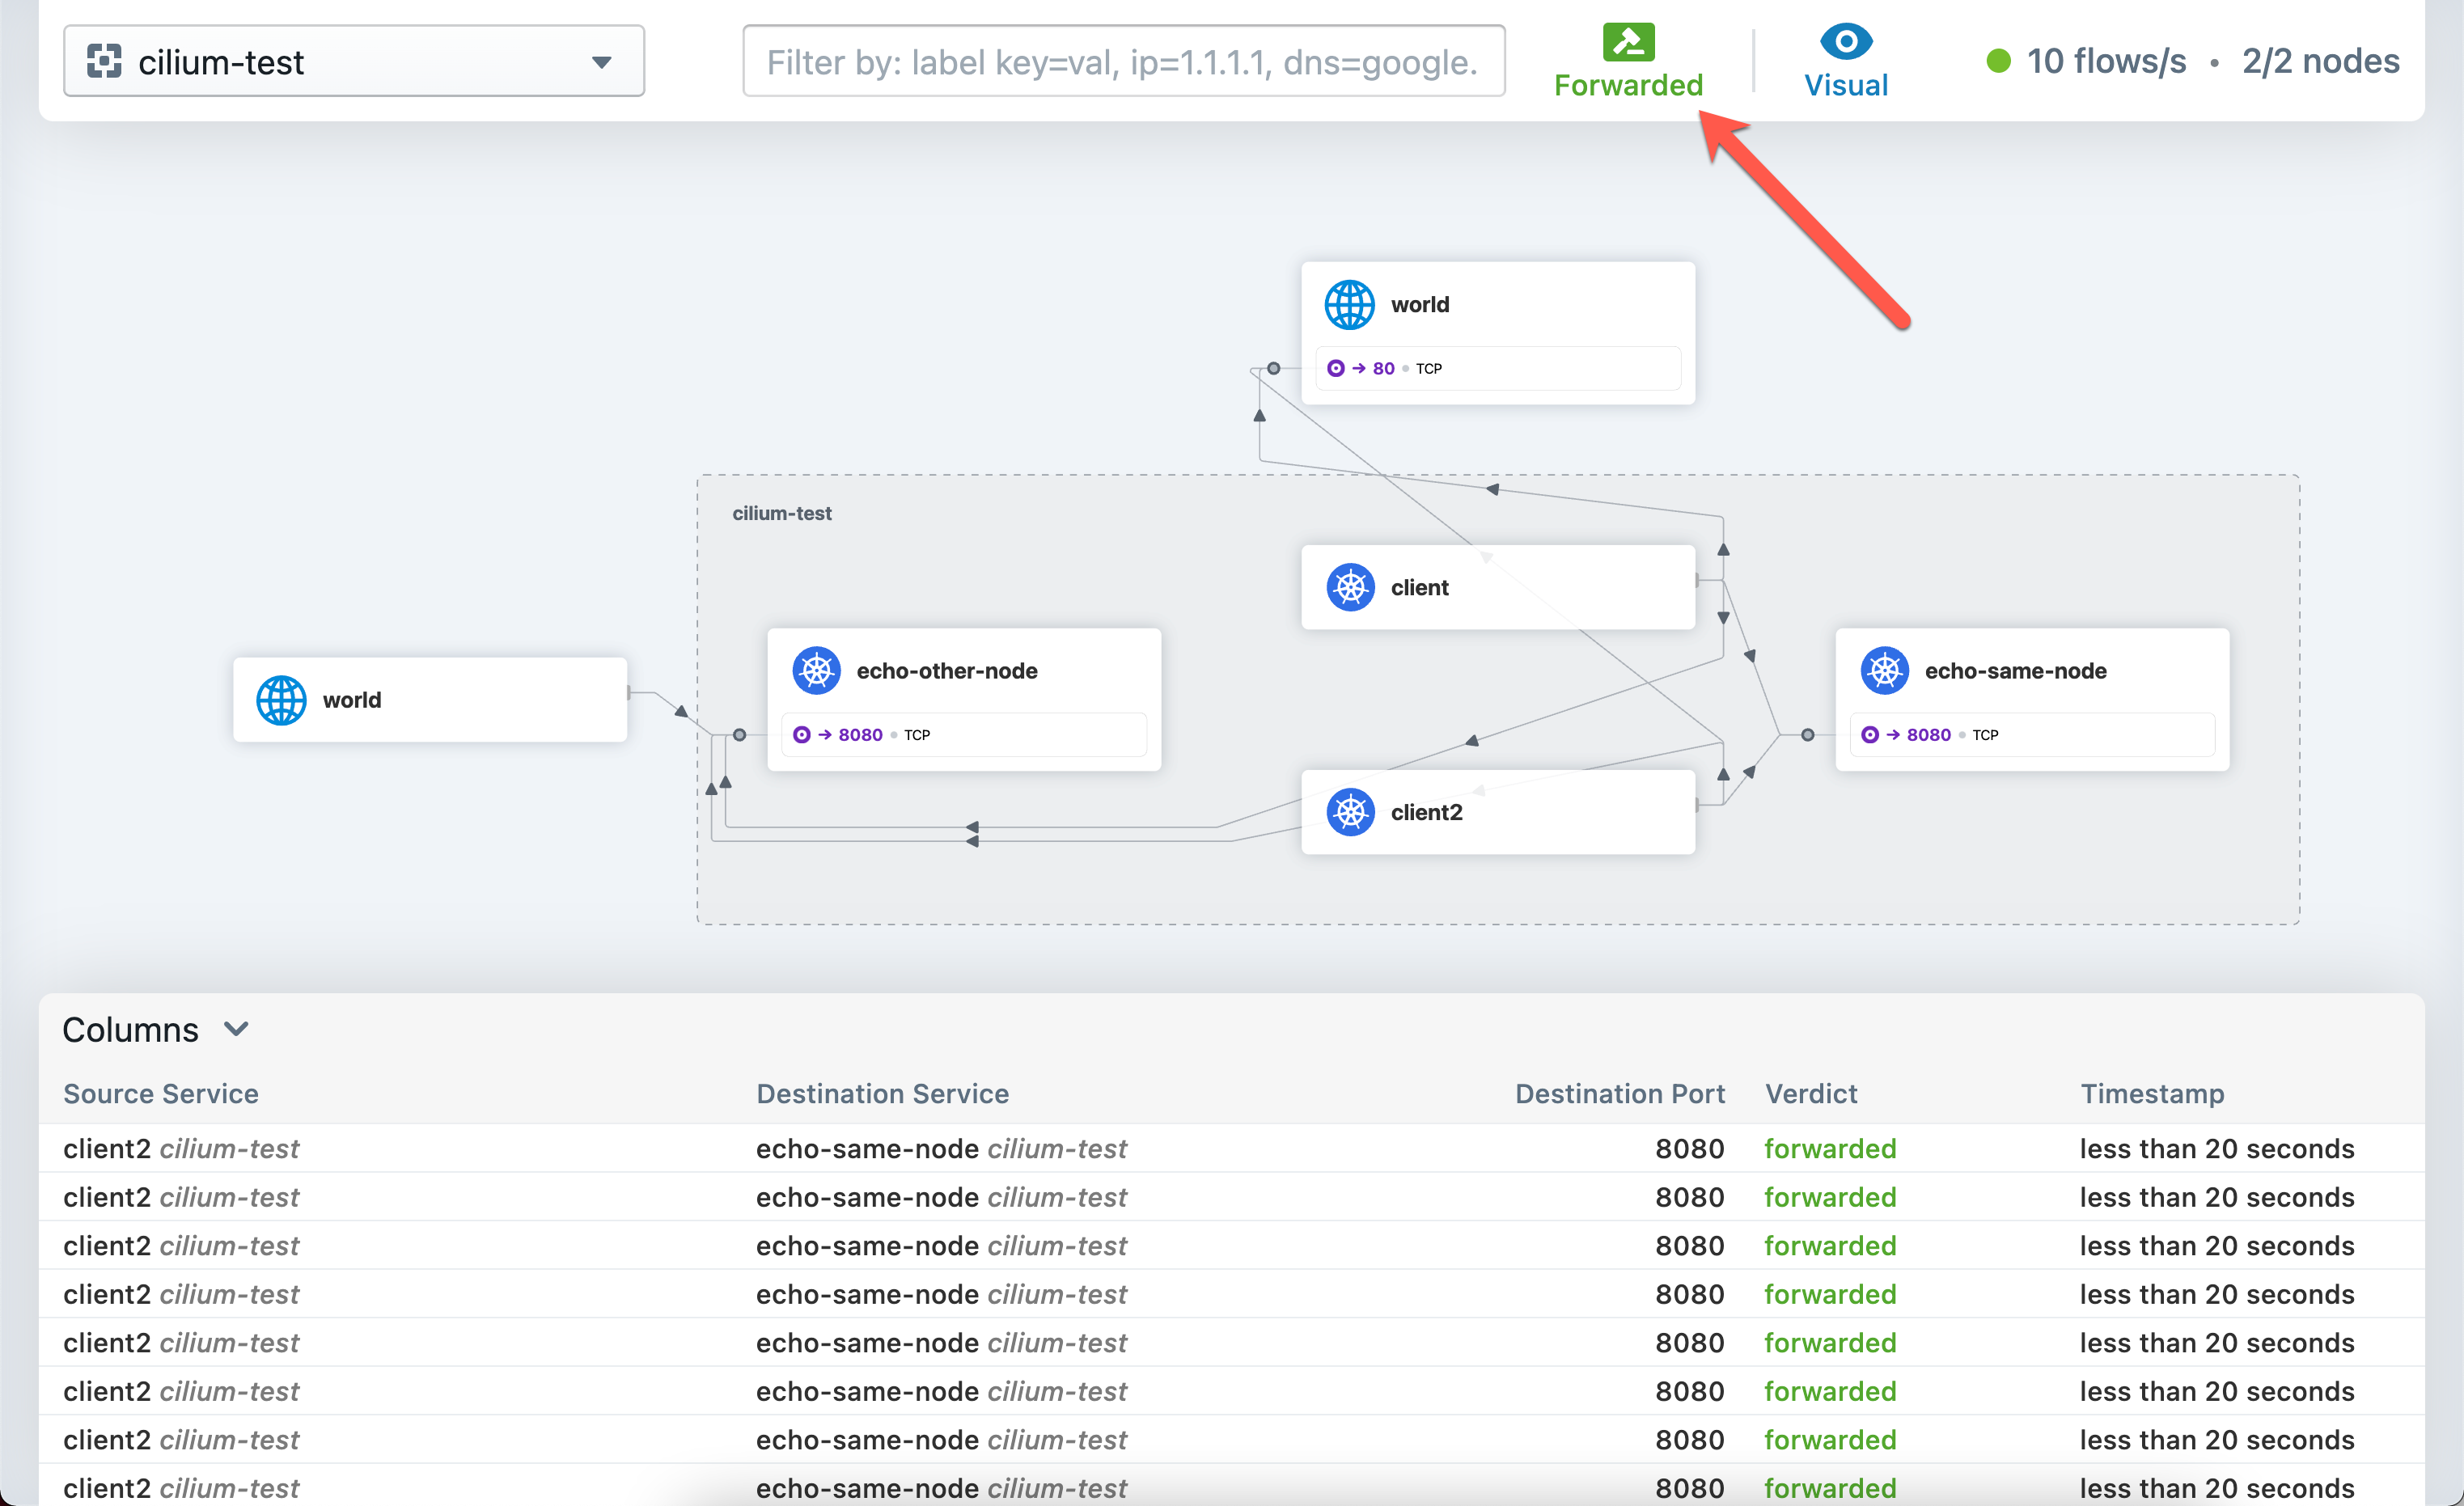
After a while, we can see the flows appearing in the Hubble UI:

More flows will start appearing as more and more flows are auto-generated. You can filter the flows based on the “verdict” (allowed or dropped flows):
Using the Hubble CLI
Hubble also comes with a CLI. Enable Port Forwarding and then you can start checking the flows with the Hubble CLI:
% cilium hubble port-forward&
[1] 24455
% hubble observe
Feb  3 11:47:20.711: 192.168.125.151:42254 -> cilium-test/echo-same-node-745bd5c77-5dp8w:8080 to-endpoint FORWARDED (TCP Flags: ACK, PSH)
Feb  3 11:47:20.711: 192.168.125.151:42254 <- cilium-test/echo-same-node-745bd5c77-5dp8w:8080 to-stack FORWARDED (TCP Flags: ACK, PSH)
Feb  3 11:47:20.712: 192.168.125.151:42254 -> cilium-test/echo-same-node-745bd5c77-5dp8w:8080 to-endpoint FORWARDED (TCP Flags: ACK, FIN)
Feb  3 11:47:20.712: 192.168.125.151:42254 <- cilium-test/echo-same-node-745bd5c77-5dp8w:8080 to-stack FORWARDED (TCP Flags: ACK, FIN)
Feb  3 11:47:20.712: 192.168.125.151:42254 -> cilium-test/echo-same-node-745bd5c77-5dp8w:8080 to-endpoint FORWARDED (TCP Flags: ACK)
Feb  3 11:47:21.405: 192.168.152.125:44452 -> cilium-test/echo-other-node-f4d46f75b-gqnpb:8080 to-endpoint FORWARDED (TCP Flags: ACK, PSH)
You can use “hubble observe” to check the flows within a namespace:
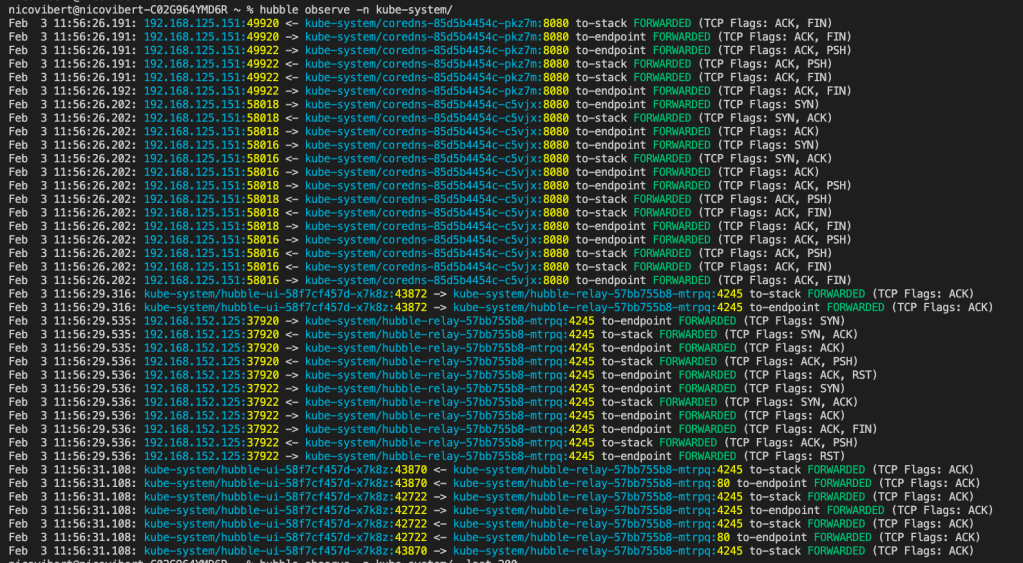
Or to check the flows that have been dropped:
% hubble observe --verdict DROPPED
Feb  3 11:54:59.976: fe80::74a0:92ff:fe24:b7d0 <> ff02::2 Unsupported L3 protocol DROPPED (ICMPv6 RouterSolicitation)
Feb  3 11:57:11.044: fe80::c466:f3ff:fe83:2301 <> ff02::2 Unsupported L3 protocol DROPPED (ICMPv6 RouterSolicitation)
What would be particularly useful would be to use it to filter based on labels:
% hubble observe -l name=client2
Feb  3 12:10:59.704: cilium-test/client2-5998d566b4-nszft:44140 -> cilium-test/echo-other-node-f4d46f75b-gqnpb:8080 to-endpoint FORWARDED (TCP Flags: ACK, FIN)
Feb  3 12:10:59.705: cilium-test/client2-5998d566b4-nszft:44140 <- cilium-test/echo-other-node-f4d46f75b-gqnpb:8080 to-stack FORWARDED (TCP Flags: ACK, FIN)
Feb  3 12:10:59.705: cilium-test/client2-5998d566b4-nszft:44140 -> cilium-test/echo-other-node-f4d46f75b-gqnpb:8080 to-endpoint FORWARDED (TCP Flags: ACK)
Feb  3 12:11:55.332: cilium-test/client2-5998d566b4-nszft:34076 -> cilium-test/echo-other-node-f4d46f75b-gqnpb:8080 L3-Only FORWARDED (TCP Flags: SYN)
Feb  3 12:11:55.332: cilium-test/client2-5998d566b4-nszft:34076 -> cilium-test/echo-other-node-f4d46f75b-gqnpb:8080 to-endpoint FORWARDED (TCP Flags: SYN)
Feb  3 12:11:55.332: cilium-test/client2-5998d566b4-nszft:34076 <- cilium-test/echo-other-node-f4d46f75b-gqnpb:8080 to-stack FORWARDED (TCP Flags: SYN, ACK)
Feb  3 12:11:55.333: cilium-test/client2-5998d566b4-nszft:34076 -> cilium-test/echo-other-node-f4d46f75b-gqnpb:8080 to-endpoint FORWARDED (TCP Flags: ACK)
There is a lot more you can do once you integrate with Prometheus but I haven’t gone that far into it yet (I do have a day job, you know).
Troubleshooting
So far, it’s been pretty smooth to run and install these tools. I did run into some issues when I somehow ended up following a guide for an older version of Cilium but when I asked on the Cilium & eBPF Slack, folks were very quick to troubleshoot and advice.
My issue was that the Hubble UI kept on crashing. Here are some of the commands to use to troubleshoot:
% cilium status
    /¯¯
 /¯¯__/¯¯    Cilium:         OK
 __/¯¯__/    Operator:       OK
 /¯¯__/¯¯    Hubble:         OK
 __/¯¯__/    ClusterMesh:    disabled
    __/

Deployment        cilium-operator    Desired: 2, Ready: 2/2, Available: 2/2
Deployment        hubble-relay       Desired: 1, Ready: 1/1, Available: 1/1
Deployment        hubble-ui          Desired: 1, Unavailable: 1/1
DaemonSet         cilium             Desired: 2, Ready: 2/2, Available: 2/2
Containers:       cilium             Running: 2
                  cilium-operator    Running: 2
                  hubble-relay       Running: 1
                  hubble-ui          Running: 1
Cluster Pods:     15/15 managed by Cilium
Image versions    cilium             quay.io/cilium/cilium:v1.9.12: 2
                  cilium-operator    quay.io/cilium/operator-aws:v1.9.12: 2
                  hubble-relay       quay.io/cilium/hubble-relay:v1.9.12: 1
                  hubble-ui          quay.io/cilium/hubble-ui:v0.8.5@sha256:4eaca1ec1741043cfba6066a165b3bf251590cf4ac66371c4f63fbed2224ebb4: 1
                  hubble-ui          quay.io/cilium/hubble-ui-backend:v0.8.5@sha256:2bce50cf6c32719d072706f7ceccad654bfa907b2745a496da99610776fe31ed: 1
                  hubble-ui          docker.io/envoyproxy/envoy:v1.18.4@sha256:e5c2bb2870d0e59ce917a5100311813b4ede96ce4eb0c6bfa879e3fbe3e83935: 1
Errors:           hubble-ui          hubble-ui    1 pods of Deployment hubble-ui are not ready
OK so one pod of Deployment Hubble-UI is not ready. Let’s use kubectl to get more details on the status of the pods.
% kubectl get pods -n kube-system
NAME                               READY   STATUS             RESTARTS   AGE
cilium-cp7wk                       1/1     Running            0          87m
cilium-node-init-b8h6w             1/1     Running            0          87m
cilium-node-init-rtblw             1/1     Running            0          87m
cilium-operator-5cb4757646-7qjvx   1/1     Running            0          90m
cilium-operator-5cb4757646-cpcnw   1/1     Running            0          90m
cilium-q6vsh                       1/1     Running            0          87m
coredns-85d5b4454c-6nq2n           1/1     Running            0          118m
coredns-85d5b4454c-7wmwc           1/1     Running            0          118m
hubble-relay-6547b86c49-hmgxx      1/1     Running            0          80m
hubble-ui-5f7cdc86c7-t6mkx         2/3     CrashLoopBackOff   20         80m
kube-proxy-46tdz                   1/1     Running            0          87m
kube-proxy-7h7c4                   1/1     Running            0          87m
The Hubble UI pod is made out of 3 containers, 2 of them are fine but one appears to have some issues. Let’s find out what:
% kubectl -n kube-system describe pod hubble-ui-5f7cdc86c7-t6mkx
Name:         hubble-ui-5f7cdc86c7-t6mkx
Namespace:    kube-system
Priority:     0
Node:         ip-192-168-30-68.us-west-2.compute.internal/192.168.30.68
Start Time:   Fri, 28 Jan 2022 08:20:02 +0000
Labels:       k8s-app=hubble-ui
              pod-template-hash=5f7cdc86c7
Annotations:  kubernetes.io/psp: eks.privileged
Status:       Running
IP:           192.168.105.243
IPs:
  IP:           192.168.105.243
Controlled By:  ReplicaSet/hubble-ui-5f7cdc86c7
Containers:
  frontend:
    Container ID:   docker://3f4f343691c99d5b5c15727d1d92615f0838041a38b11ae6352bc8079fa86ffa
    Image:          quay.io/cilium/hubble-ui:v0.8.5@sha256:4eaca1ec1741043cfba6066a165b3bf251590cf4ac66371c4f63fbed2224ebb4
    Image ID:       docker-pullable://quay.io/cilium/hubble-ui@sha256:4eaca1ec1741043cfba6066a165b3bf251590cf4ac66371c4f63fbed2224ebb4
    Port:           8080/TCP
    Host Port:      0/TCP
    State:          Running
      Started:      Fri, 28 Jan 2022 08:20:08 +0000
    Ready:          True
    Restart Count:  0
    Environment:    <none>
    Mounts:
      /var/run/secrets/kubernetes.io/serviceaccount from kube-api-access-jh6kc (ro)
  backend:
    Container ID:   docker://69dc0b1d5d30997bcbed5dbdb2ae37716dc3643bdadcfa44d5ee24214273bfb0
    Image:          quay.io/cilium/hubble-ui-backend:v0.8.5@sha256:2bce50cf6c32719d072706f7ceccad654bfa907b2745a496da99610776fe31ed
    Image ID:       docker-pullable://quay.io/cilium/hubble-ui-backend@sha256:2bce50cf6c32719d072706f7ceccad654bfa907b2745a496da99610776fe31ed
    Port:           8090/TCP
    Host Port:      0/TCP
    State:          Running
      Started:      Fri, 28 Jan 2022 08:20:12 +0000
    Ready:          True
    Restart Count:  0
    Environment:
      EVENTS_SERVER_PORT:  8090
      FLOWS_API_ADDR:      hubble-relay:80
    Mounts:
      /var/run/secrets/kubernetes.io/serviceaccount from kube-api-access-jh6kc (ro)
  proxy:
    Container ID:  docker://893604757fb94327d7d3a7f45fc6f868664f322ae394491e73f852d3df3f0131
    Image:         docker.io/envoyproxy/envoy:v1.18.4@sha256:e5c2bb2870d0e59ce917a5100311813b4ede96ce4eb0c6bfa879e3fbe3e83935
    Image ID:      docker-pullable://envoyproxy/envoy@sha256:e5c2bb2870d0e59ce917a5100311813b4ede96ce4eb0c6bfa879e3fbe3e83935
    Port:          8081/TCP
    Host Port:     0/TCP
    Command:
      envoy
    Args:
      -c
      /etc/envoy.yaml
      -l
      info
    State:          Waiting
      Reason:       CrashLoopBackOff
    Last State:     Terminated
      Reason:       Error
      Exit Code:    1
      Started:      Fri, 28 Jan 2022 09:37:30 +0000
      Finished:     Fri, 28 Jan 2022 09:37:30 +0000
    Ready:          False
    Restart Count:  20
    Environment:    <none>
    Mounts:
      /etc/envoy.yaml from hubble-ui-envoy-yaml (rw,path="envoy.yaml")
      /var/run/secrets/kubernetes.io/serviceaccount from kube-api-access-jh6kc (ro)
Conditions:
  Type              Status
  Initialized       True
  Ready             False
  ContainersReady   False
  PodScheduled      True
Volumes:
  hubble-ui-envoy-yaml:
    Type:      ConfigMap (a volume populated by a ConfigMap)
    Name:      hubble-ui-envoy
    Optional:  false
  kube-api-access-jh6kc:
    Type:                    Projected (a volume that contains injected data from multiple sources)
    TokenExpirationSeconds:  3607
    ConfigMapName:           kube-root-ca.crt
    ConfigMapOptional:       <nil>
    DownwardAPI:             true
QoS Class:                   BestEffort
Node-Selectors:              <none>
Tolerations:                 node.kubernetes.io/not-ready:NoExecute op=Exists for 300s
                             node.kubernetes.io/unreachable:NoExecute op=Exists for 300s
Events:
  Type     Reason   Age                  From     Message
  ----     ------   ----                 ----     -------
  Warning  BackOff  59s (x367 over 80m)  kubelet  Back-off restarting failed container
As you can see on line 58 above, it became apparent it was the proxy that was misbehaving (the frontend and backend containers were fine). Let’s check the logs on the proxy:
% kubectl -n kube-system logs hubble-ui-5f7cdc86c7-t6mkx proxy
...
[2022-01-28 10:08:12.776][1][warning][misc] [source/common/protobuf/utility.cc:312] Configuration does not parse cleanly as v3. v2 configuration is deprecated and will be removed from Envoy at the start of Q1 2021:
[2022-01-28 10:08:12.777][1][critical][main] [source/server/server.cc:113] error initializing configuration '/etc/envoy.yaml': The v2 xDS major version is deprecated and disabled by default. Support for v2 will be removed from Envoy at the start of Q1 2021. You may make use of v2 in Q4 2020 by following the advice in https://www.envoyproxy.io/docs/envoy/latest/faq/api/transition.
.....
The issue was with the Envoy config on the version of Cilium I was using (1.9). It had not been using the latest APIs as you can see above.
Once I upgraded to 1.11, everything worked very smoothly.
To recap, using Hubble was pretty straight-forward and it gave us interesting insight on network flows. It’s another nice use case for leveraging eBPF-based technologies.
Thanks for reading.
